The 532 new units projected to open in 2023 is 53% higher than the average Chittenden County growth over the past 3 years, and 82% higher than the long-term average since 2000. Of the 532 expected units, 57% (304) are already completed as of June. For comparison, the total of new units constructed in 2022 was 291, a promising indicator.
AVERAGE APARTMENT RENTS IN CHITTENDEN COUNTY
RANGE
Studio, 1 bath
$1,200 - $1,985
1 Bedroom
$1,400 - $2,100
2 Bedroom, 1 Bath
$1,700 - $2,300
2 Bedroom, 2 Bath
$1,950 - $3,300
Of the 532 units expected to open, 206 (39%) are projected to open in South Burlington. Essex/Essex Junction is expecting 96 (18%) units, followed by Colchester 78 (15%), and Burlington 72 (13%). The rest are opening in Shelburne, Williston, and Milton. Most of the new units are identified as market rate units with a growth in “Affordable, Family” units over the prior year.
The apartment vacancy rate in Chittenden County increased slightly for the first time since the June 2020 report to 1%. For comparison, the national average is just under 5%.
Due to limited inventory, the average monthly rent has continued to increase, with the average cost of a 2-bedroom being reported at just over $1,600 a month as of the latest rent survey* with a more typical cost hovering around $2,000 per month.
As with the residential housing market, the need to act quickly is now more important than ever. Landlords do not hold apartments, the first person to provide the necessary deposit and signed lease are the ones who secure the apartment. Unfortunately, renters often must push their wants to the side and focus on their needs to find a rental option within the timeframe they require.
Source: Allen, Brooks, & Minor Report, June 2023
South Bingham Street, Cornwall, VT ~ This 37-acre land offering is a wonderful mix of an old orchard, returned back to its natural state, to the west and a maturing woodland habitat to the east with a healthy 5-acre pond in the middle.
Single-Family January-June 2023
Median Sale Price:
Units Sold:
Newly Listed:
Days on Market:
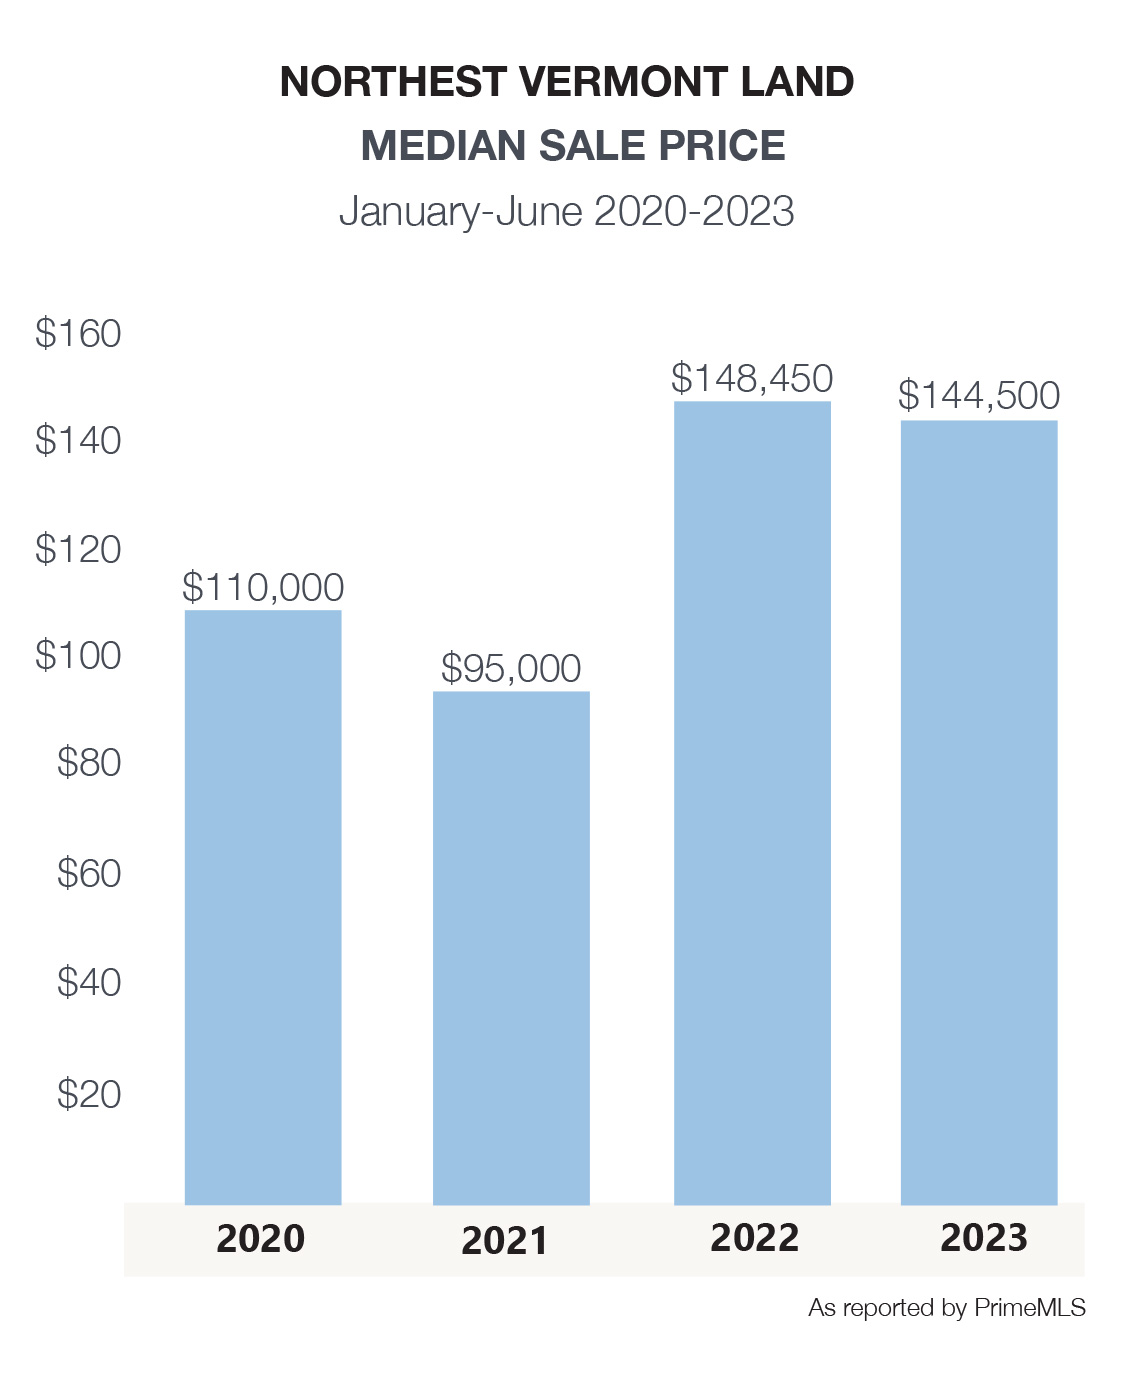
$144,500 -3%
92 -28%
162 -14.7%
130 -18.2%
The number of land parcels that have sold during the first half of 2023 declined sharply over the same period last year, on top of the 27% decline in 2022. This period of decline follows amplified sales realized in 2021. However, this year’s results do not accurately reflect buyer interest as much as the same shortage in available inventory we are seeing in other segments of the real estate market. The number of days on the market for land is just over 4 months, down from 5 months in 2022 and 8 months in 2021 demonstrating that buyers were ready to make a move when the right property hit the market.
Franklin County’s median price jumped nearly 28% to $126,000 yet remains more affordable than other northwest Vermont counties. Addison County and Franklin County, with more undeveloped land, posted the most sales in the region with 30 and 29 closed respectively.
Long term, the solution must include more and larger development to meet demand. Reputable and well-established builders are working hard to roll out new projects and additional phases of established communities. Extensive permitting and labor shortages are impacting cost, ultimately absorbed by purchasers. More action by state and local officials is needed to satisfy demand, address affordability, and positively impact our aging housing stock.
MEDIAN SALE PRICE
VS 2022
UNITS SOLD
VS 2022
NEWLY LISTED
VS 2022
DAYS ON MARKET
VS 2022
Chittenden County
$208,000
-13.3%
25
-34.2%
36
-43.8%
124
-34.3%
Addison County
$148,000
8.8%
30
-33.3%
51
21.4%
124
-33.3%
Franklin County
$126,000
27.3%
29
0.0%
52
-13.3%
120
-34.1%
Grand Isle County
$93,750
3.7%
8
-50.0%
23
-4.2%
211
-45.5%
Warning: According to American Land Title, real estate transactions have been a prime target of cybercrime over the past decade. There is little sign of this slowing. Instead, fraudsters continue to evolve their scam and money laundering tactics to avoid detection.
This latest trend involves vacant lots or unencumbered properties (no mortgage). Fraudsters impersonate property owners to illegally sell commercial or residential property. Sophisticated fraudsters use the real property owner’s Social Security and driver’s license numbers in the transaction, as well as legitimate notary credentials which have all been fabricated. Commonly, the real owner of the property does not live nearby and is not aware of the sale. While many of these properties are posted on national websites as “for sale by owner” (FSBO), scammers are beginning to connect with real estate agents to list the property while posing as the real seller.
To combat schemes like this, South Burlington residents can now register to be notified by email whenever a document (sale of house, lien, mortgage, etc.) is filed in the South Burlington Clerk’s office. Other municipalities may be considering programs like this.
According to American Land Title, a monitoring system like this doesn’t prevent fraud from happening, at least you will be alerted if or when a document is filed. Be extremely wary if you find a land parcel for sale below market price, with a seller who is urgent to sell, and not available to meet in person.
As spring arrives in Vermont, along with the historical start of the busy real estate market, we are taking a close look at the 1st quarter results to provide buyers and sellers with valuable insights to make informed decisions. The housing market in northwest Vermont continues to be robust with strong demand and low inventory. Home prices have been increasing steadily, and multiple offers are still common. The median sale price for a single-family home in the region has increased by 8% to $400,000 compared to the same period last year. The number of homes sold declined by 20%, a result of the 15% decrease in new homes listed during the period – not a lack of demand.
The current higher mortgage interest rates have had an impact on the housing market. As interest rates increase, it becomes more expensive for buyers to finance a home purchase, which can reduce demand and slow down sales. However, the impact of higher interest rates can be mitigated by factors such as strong economic growth, high employment rates, and most notably a shortage of available housing inventory. It appears that many buyers have adjusted to the higher mortgage interest rates and are remaining in the market.
Despite these positive trends, the lack of available housing inventory has been a challenge for both buyers and sellers alike. Many homeowners have opted to stay put until they find a new home in the region or out-of-state, which has further constrained the market, leading to higher prices and competition among buyers. It is important to keep in mind that historically, the first quarter of the year tends to be the smallest in terms of listing and real estate sales volume. Statistically, increases and decreases can be affected by a few changes in the product mix. The next 6 months will be a more accurate benchmark of market trends. Overall, the housing market in northwest Vermont is showing no signs of slowing down, and it will be interesting to see how the market continues to evolve throughout the rest of the year.
Our agents have been closely monitoring the current housing market and have observed some interesting trends. Despite the challenges posed by the shortage of available inventory and higher prices, most of our agents (70%) have reported that they have the same or more buyers looking for homes than before. This is a testament to the continued strength of demand in our market areas. However, with so many buyers competing for limited inventory, nearly 90% of offers have been in multiple offer situations, making it increasingly difficult for buyers to secure a property.
Despite this, some buyers are still including inspections and financing contingencies in their offers, indicating that they are taking a more measured approach to their purchases. On the seller side, we have seen that most trust their agent’s advice on current market conditions and are readying their homes for the spring selling season. However, it is worth noting that many sellers are challenged when searching for a new home to move to, whether in Vermont or across the country. Finally, most of our agents report an increase in the pace of the market in the past month, which suggests that buyers and sellers alike need to be ready to act when the right opportunity presents itself.
1.5 Acre Lot With Lake Views! Two lots remain on Terrapin Lane, an eleven lot lakeshore community. Nestled between Lake Champlain and the rolling fairways and greens of the Alburgh Golf Links.
Single-Family Q1 2023
New Listings
Units Sold
Median Sold Price
Days on Market
21 (-22%)
10 (-57%)
$370K (+12%)
8 (-82%)
The Grand Isle real estate market saw a significant decline of approximately 56.5% in new listings for all types of homes in the first quarter of 2023, compared to the same period last year. This limited the inventory available for buyers and contributed to an overall decline in sales volume.
Despite the limited inventory, the median sales price for all types of homes in Grand Isle increased by approximately 12.0% year-over-year, indicating continued strong demand in this segment of the market.
The Grand Isle real estate market also saw a decline in days on the market for all types of homes, with the average number of days on market dropping to just 19 days in the first quarter of 2023. This suggests that homes are selling quickly in this area, potentially due to the high demand and limited inventory
This outcome may primarily reflect the seasonality, as Grand Isle County’s real estate market is heavily influenced by sales of lakefront properties. Notably, the county did not disclose any condominium sales during the period of January through March
Luxury Retreat in Waterbury! Nestled in the hills between Waterbury Reservoir and Worcester Mountain Range, this stunning home faces east for a morning glow and stunning mountain scenery. Waterbury | MLS# 4948757
Single Family Q1 2023
New Listings
Units Sold
Median Sold Price
Days on Market
79 (-26%)
62 (-45%)
$319K (+23%)
21 (+75%)
Condo Q1 2023
New Listings
Units Sold
Median Sold Price
Days on Market
30 (-21%)
19 (+0%)
$320K (+52%)
10 (-44%)
The first quarter of 2023 was challenging for the single-family home market in Washington County, with a significant decline of around 45% in sales volume compared to the same period last year. Additionally, new listings for single-family homes in the county dropped by approximately 26% year-over-year, contributing to the limited inventory and increased competition among buyers.
Despite the challenges faced by the single-family home market, the median sold price for single-family homes in Washington County increased by approximately 23% compared to the first quarter of 2022, indicating that demand remains strong in this segment of the market.
The condo market in Washington County was more stable, with flat sales volume but a significant increase of around 52% in the median sold price for condos compared to the first quarter of 2022. However, the number of new listings for condos dropped by approximately 21% year-over-year, indicating that inventory remains limited in this segment of the market as well.
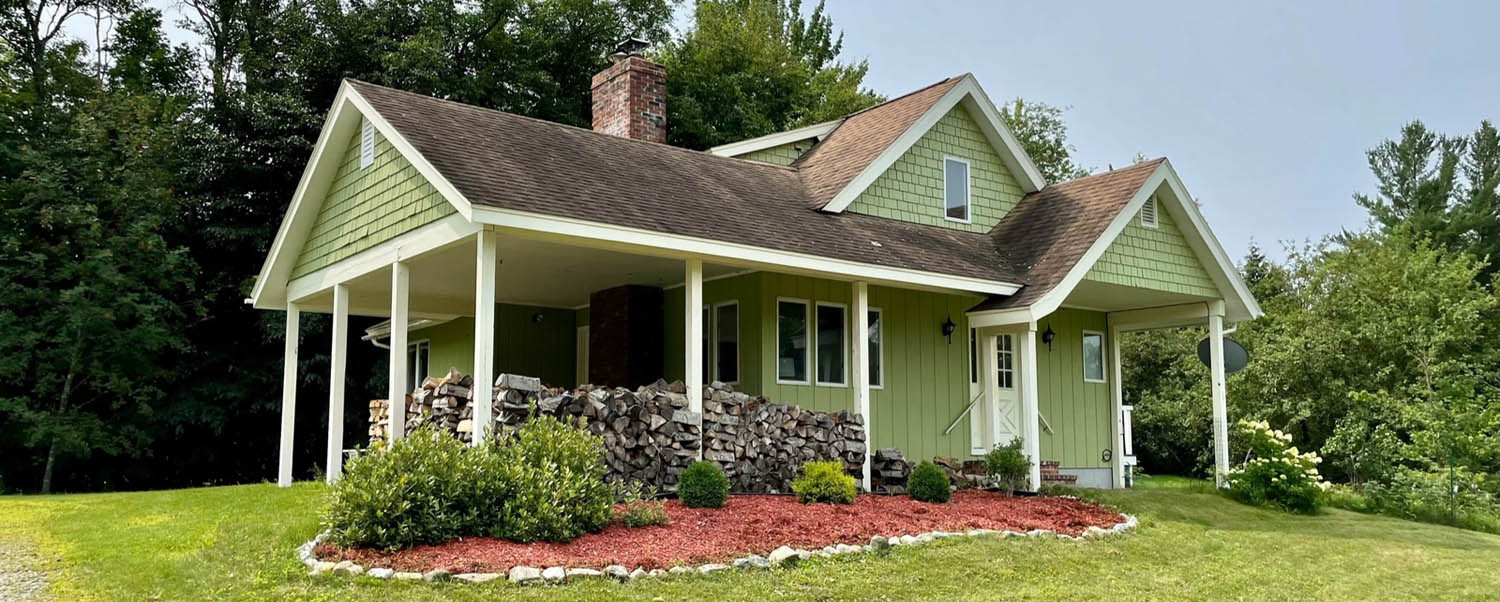
Jeffersonville Dream Come True Well maintained & updated 3 bedroom, 2.5 bath sunlit Cape, located near the end of a sleepy cul-de-sac just minutes away from all that Jeffersonville has to offer. Cambridge
Single-Family Q1 2023
New Listings
Units Sold
Median Sold Price
Days on Market
53 (-21%)
42 (-31%)
$498K (+14%)
24 (+60%)
Condos Q1 2023
New Listings
Units Sold
Median Sold Price
Days on Market
37 (+23%)
28 (+27%)
$463K (+26%)
27 (-6.90%)
Lamoille County‘s single-family home market saw a decline in both sales volume and new listings in the first quarter of 2023, with a drop of approximately 31% and 21%, respectively, compared to the same period last year.
Despite the lower sales volume and limited inventory, the median sold price for single-family homes in the county increased by approximately 14.7% year-over-year, indicating continued strong demand in this segment of the market.
The condo market in Lamoille County fared better, with a median price increase of around 26% compared to the first quarter of 2022, and an increase in both sales volume (27.7%) and new listings (23%) for condos. This suggests that the condo market may be a more attractive option for buyers in this area, given the limited inventory for single-family homes.
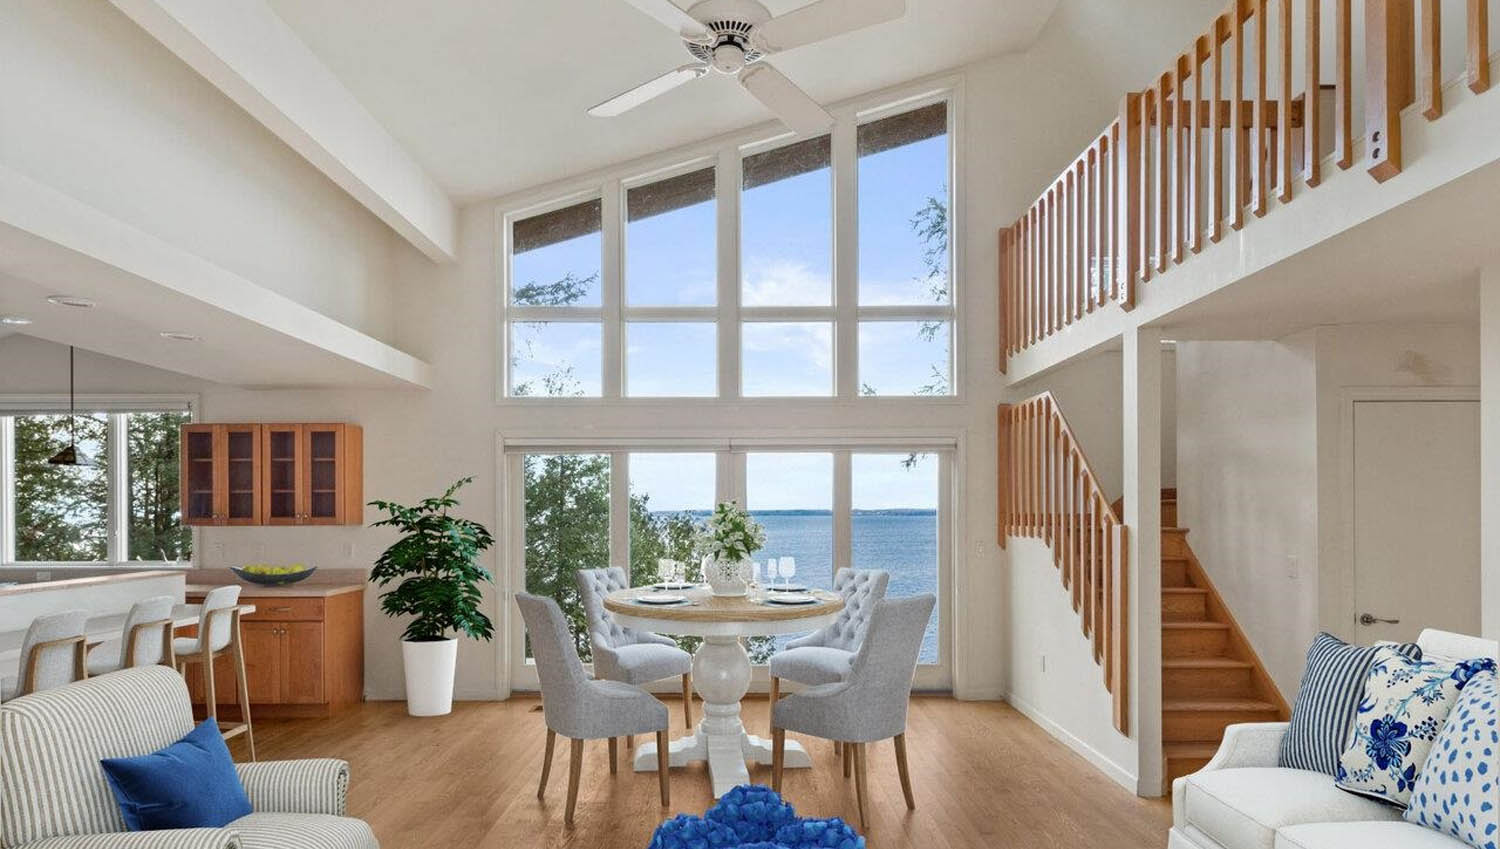
Beautiful Contemporary Home Located on a beautiful 1-acre parcel across from Lake Champlain, this contemporary home enjoys stunning western views of Lake Champlain and the Adirondack Mountains
Single-Family Q1 2023
New Listings
Units Sold
Median Sold Price
Days on Market
97 (-12%)
73 (-28%)
$319K (+8.14%)
16 (-11%)
Condos Q1 2023
New Listings
Units Sold
Median Sold Price
Days on Market
7 (-36%)
2 (-82%)
$298K (+8.18%)
15 (+7.14%)
The first quarter of 2023 saw a decline of approximately 27% in closed sales for single-family homes in Franklin County, compared to the same period last year. Additionally, new listings for single-family homes in the county dropped by around 12% year-over-year, contributing to the limited inventory and increased competition among buyers. Days on the market for all single-family homes decreased to just 47 days during this period, suggesting that the market is moving quickly and homes are selling at a relatively fast pace.
Despite the challenges faced by the single-family home market in Franklin County, the median sold price for homes increased by around 8% compared to the first quarter of 2022, demonstrating that demand remains strong in this segment of the market.
Fairfax, St. Albans Town, and Swanton were the towns in Franklin County with the highest number of sales in the first quarter of 2023, indicating that these areas remain attractive to buyers.
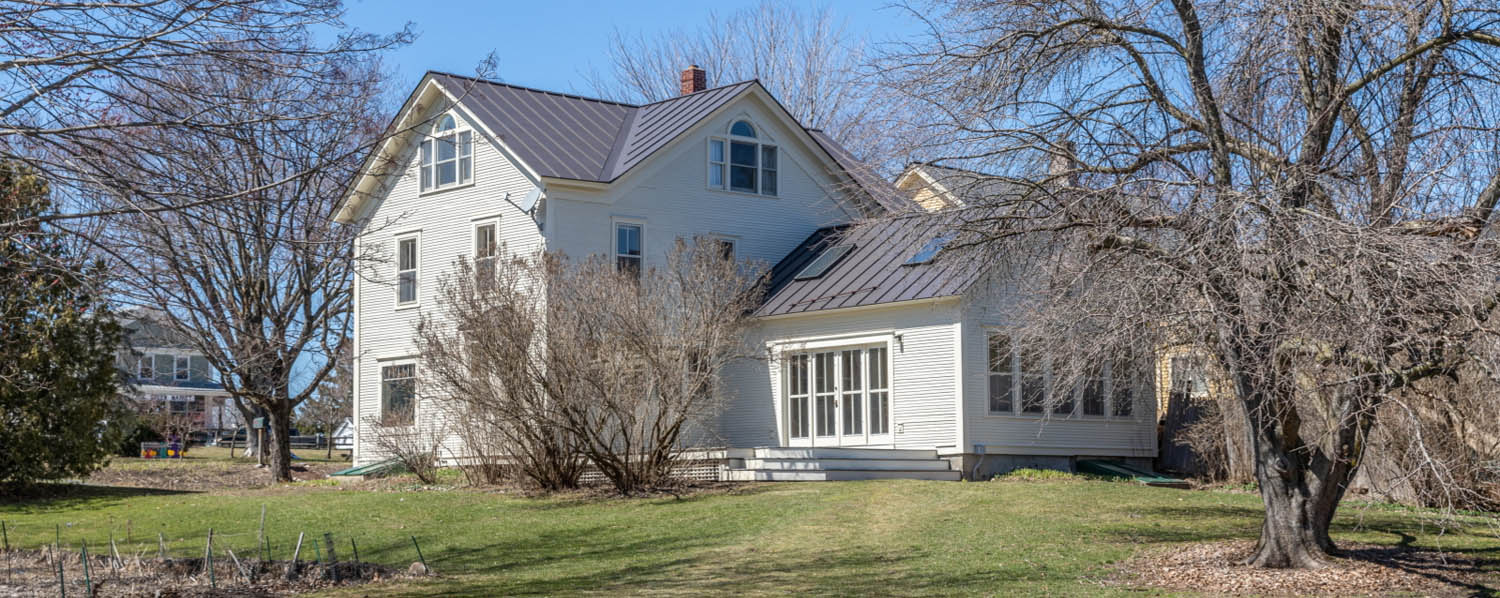
Restored 1800’s Farmhouse & Barn Located on the Village Green, this property boasts stunning views of Mt. Abraham and has charm & character throughout. New Haven
Single-Family Q1 2023
New Listings
Units Sold
Median Sold Price
Days on Market
52 (-33%)
47 (-11%)
$325k (-2.11%)
10 (+43%)
Condos Q1 2023
New Listings
Units Sold
Median Sold Price
Days on Market
4 (+0%)
3 (-57%)
$525K (+74%)
0
The first quarter of 2023 was challenging for the housing market in Addison County, Vermont. The county saw a significant drop in the number of new listings, with a decline of around 33% compared to the same period last year. This limited the options available to potential buyers and contributed to an overall decline in sales. In fact, the number of homes sold in the county dropped by approximately 11% year-over-year. The median sold price for homes in Addison County also decreased by around 2% compared to the first quarter of 2022. This is not a reflection of a drop in home values, but more a change in the mix and limited number of properties that closed during this period. Despite these declines, Addison County remains an attractive area for homebuyers due to its scenic countryside and vibrant communities. It will be interesting to see how the market evolves throughout the rest of the year and whether the shortage of available inventory will continue to be a challenge for both buyers and sellers alike.
The housing market in Addison County, Vermont, experienced a challenging first quarter in 2023, with a significant drop of approximately 33% in new listings compared to the same period last year. This limited the options available to potential buyers and contributed to an overall decline of around 11% in sales volume.
Despite the challenges faced by the housing market in Addison County, the median sold price for homes only decreased by around 2% compared to the first quarter of 2022, suggesting that demand remains strong in this segment of the market.
With limited inventory and fewer options available, it is likely that buyers will continue to face increased competition for available properties, increased prices and bidding wars in many cases. However, the market remains attractive to buyers looking for scenic countryside and vibrant communities, and it will be interesting to see how the market evolves throughout the rest of the year.
Set Above Lake Champlain Nestled in the woods above Lake Champlain, this beautiful Contemporary enjoys stunning views. Beach easement and first floor primary suite. Colchester
Single-Family Q1 2023
New Listings
Units Sold
Median Sold Price
Days on Market
183 (-24%)
160 (-7.51%)
$508K (+14%)
11 (+83%)
Condos Q1 2023
New Listings
Units Sold
Median Sold Price
Days on Market
121 (-6.2%)
77 (-32%)
$351K (+9.14%)
5 (+0%)
In Chittenden County, one of the most populous areas in northwest Vermont, the first quarter of 2023 saw a slight decrease in closed sales for single-family homes, with a decline of around 7.5% compared to the same period last year. This is due to the shortage of available inventory, as the number of new listings for single-family homes in the county dropped by approximately 24% year-over-year. This lack of inventory has led to increased competition among buyers, leading to higher prices for available properties. Despite these challenges, the real estate market in Chittenden County remains strong, with many buyers still looking to purchase homes in this desirable area. The demand for homes in good condition, priced in the $450,000 – $650,000 range seem to be the sweet spot, although most price points are moving quickly. Despite interest rates being significantly higher than the same time last year, we are predicting increased activity in the coming months.
Chittenden County’s single-family home sales decreased by approximately 7.5% in the first quarter of 2023, compared to the same period last year.
However, the median price for single-family homes in the county increased by around 14.4% year-over-year, indicating continued strong demand despite the lower sales volume.
The number of new listings for single-family homes in Chittenden County dropped by approximately 24% compared to the first quarter of 2022, contributing to the limited inventory.
The condo market in Chittenden County also saw a decline in sales volume, with a drop of around 32% compared to the same period last year. However, the median price for condos increased by around 9%, indicating that demand remains strong in this segment of the market.
In Milton, a town located in Chittenden County, closed sales of single-family homes increased by an impressive 56% compared to the first quarter of 2022, outpacing the county-wide trend.
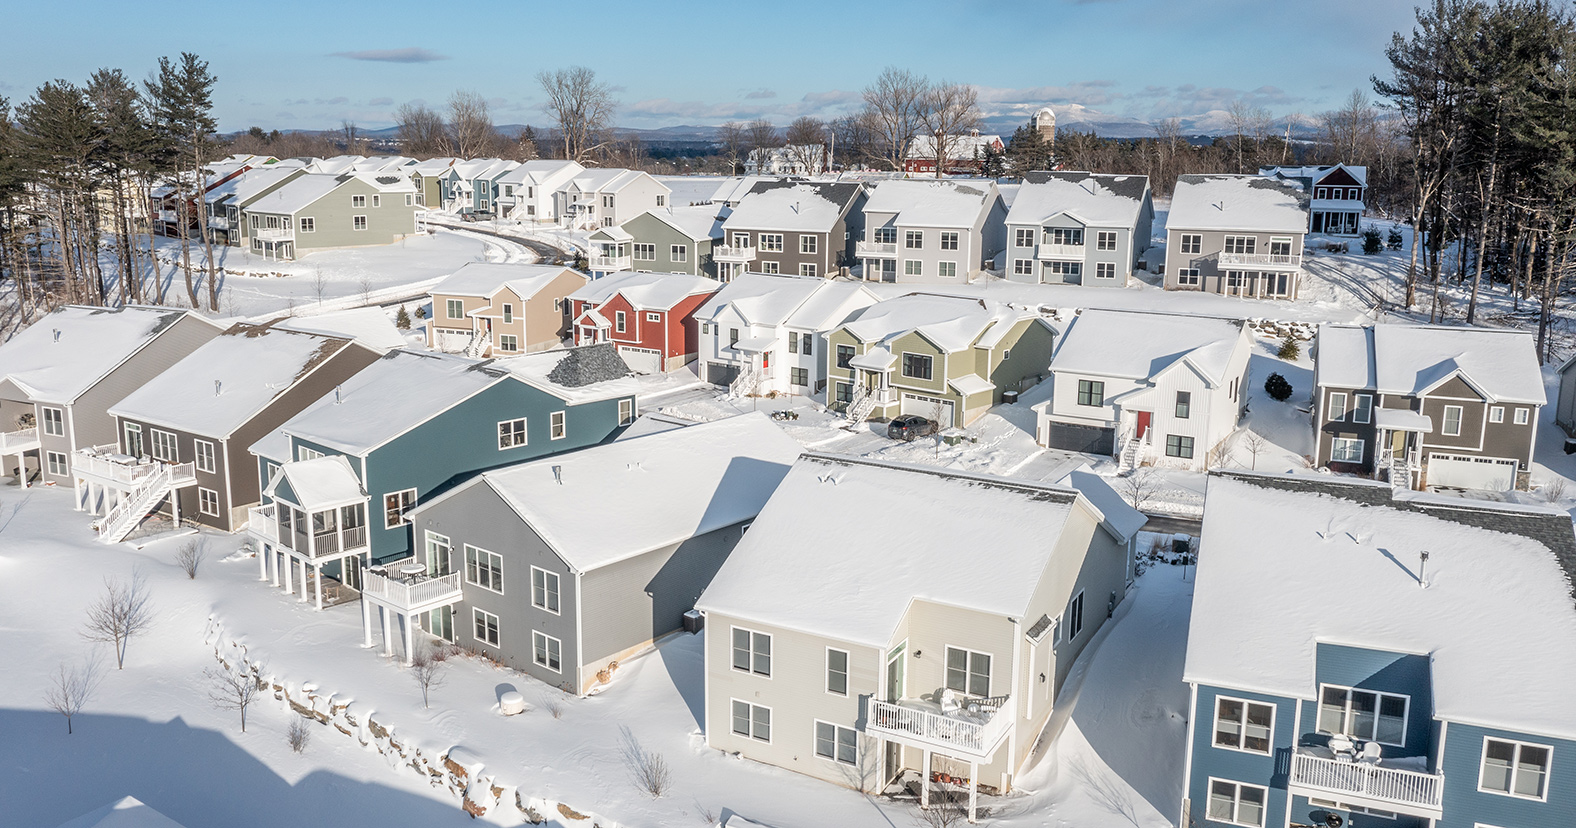
Hillside at O’Brien Farm is a 30+ acre neighborhood of thoughtfully designed, energy efficient homes in the heart of South Burlington.
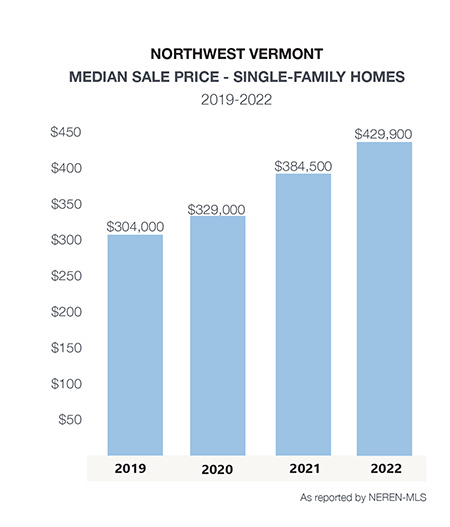
As we review the real estate market results for 2022 and try to predict the market trends for 2023, one thing remains true – real estate is local. We will attempt to cut through the clutter and the sensational headlines to bring you a local and relevant perspective on real estate in northwest Vermont including Chittenden, Addison, Franklin and Grand Isle Counties.
Single-Family January-December 2022
Median Sale Price:
Average Sale Price:
Units Sold:
Newly Listed:
Days on Market:
$429,900 +11.8%
$501,166 +13.7%
2,125 -20.3%
2,371 -16.8%
25 -34.2%
Condo January-December 2022
Median Sale Price:
Average Sale Price:
Units Sold:
Newly Listed:
Days on Market:
$340,000 +23.6%
$384,461 +21.2%
706 -5.9%
700 -12.9%
21 -27.6%
Multi-Family January-December 2022
Median Sale Price:
Average Sale Price:
Units Sold:
Newly Listed:
Days on Market:
$490,000 +14.0%
$510,618 -5.4%
183 -25%
204 -32.9%
54 -8.5%
Land January-December 2022
Median Sale Price:
Average Sale Price:
Units Sold:
Newly Listed:
Days on Market:
$138,500 +32.2%
$210,407 +23.1%
234 -27.3%
322 -14.1%
154 -35%
In summing up 2022, the story of the year was mortgage interest rates. Mortgage rates ended 2021 and opened 2022 just below 3% on a 30-year fixed rate, conventional loan. By mid-year, rates doubled, eclipsing 7.0%. By December, they had settled at 5.875% to the low 6% range. Inflation was the biggest driver of the rate increases as the Federal Reserve took action and began hiking the Fed Funds rate. Investors are starting to breathe a sigh of relief that the worst inflation may be behind us, but with the Consumer Price Index (CPI) still higher than the Fed prefers, mortgage rates may stay in the high 5% to low 6% range through most of 2023, with a modest adjustment not expected until Q4 of 2023.
What does that mean for buyers interested in purchasing a home? When you find a home that you like, buy it! Interest rates will likely never return to the 3% range we have benefited from over the past few years. The median sale price of homes has been increasing and will continue to do so in 2023 (although not at the rate of the past 3 years). And, inventory remains limited. The saying we keep hearing is “Marry the home, date the rate!” Many buyers are now considering adjustable-rate mortgages (ARMs) to keep their payments a bit lower in the short term. If you commit to a home, you will have the opportunity to refinance if and when mortgage interest rates go down.
The biggest factor impacting the real estate market both locally and nationally is the deficit of inventory. Nationally, this deficit is estimated to be 3.8 million homes. Locally, the Vermont Futures Project has estimated the immediate deficit to be 5000 homes; although this may be underestimating the problem. We are not digging our way out of the problem as we continue to “under build.” New construction plays a critical role; however, it is not meeting demand for a variety of reasons including labor shortages, construction costs, and land development costs. In northwest Vermont, there were double digit declines in the number of closed sales across all property types (residential, multi family, and land) in 2022. These declines do not reflect consumer demand but are a direct result of the lack of properties available for sale. In the past 2 years, the number of single-family homes and condos for sale monthly, has dropped 28%.
During December of 2022, there were only 384 properties available across northwest Vermont – compared to 659 in December of 2020.At the peak of the traditional 2022 real estate season, there were only 694 residential properties for sale with 330 going Under Contract. This calculates to only 2 months’ supply of inventory on the market – continuing a strong seller’s market. A balanced market (not a seller’s nor buyer’s market) would have approximately 4-6 months’ supply of inventory for sale. The number of homes for sale won’t increase significantly in 2023 as many homeowners do not want to lose their current low mortgage rate. Sellers will continue to move for life transitions such as career changes, family status changes, or aging out of a home.
In 2023, sellers should adjust their expectations. With higher interest rates, there still are buyers out there but not as many as 2021 and early 2022. Sellers will still reap the benefits of strong equity positions in their homes. Offers may come with inspection and financing contingencies. Understanding the current market conditions affecting their home, sellers will benefit from working with an experienced Agent who can guide them to closing with the best terms for them.
A stable and uneventful market is what we need over the next few years. Experts are predicting modest price growth in 2023. In northwest Vermont, we estimate a 3 – 5% increase in prices depending on the market segment. Properties priced below $600,000 and properties in move-in condition will continue to be in strong demand. The shock of the recent interest rate increases will give way to acceptance by buyers.
Millennials and Gen Z view real estate to be a means to build wealth as well as contribute to their quality of life. A recent Chase Home Lending survey found that 2 in 5 first time home buyers were living with family in order to save for a home. 58% of those surveyed think they will be ready to buy in the next 12 months. Indeed, home ownership continues to be the American dream.


 The current higher
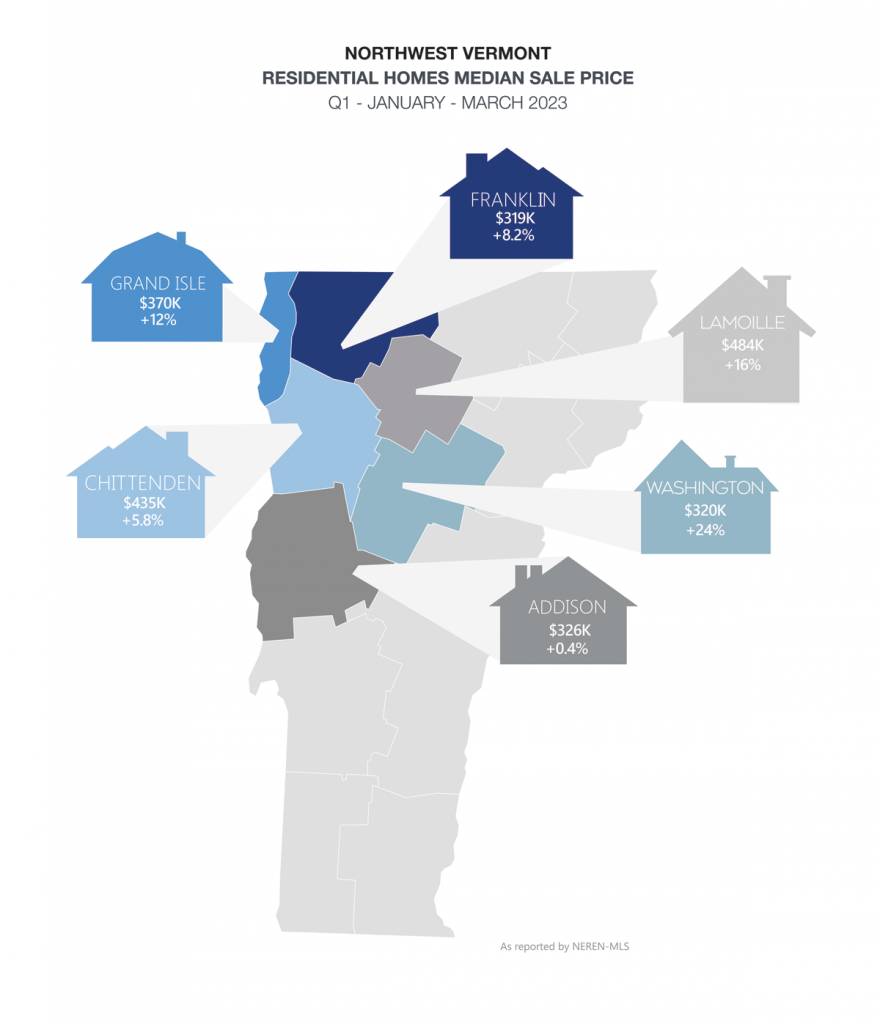


 The biggest factor impacting the
  In 2023, sellers should adjust their expectations. With higher interest rates, there still are buyers out there but not as many as 2021 and early 2022. Sellers will still reap the benefits of strong equity positions in their homes. Offers may come with inspection and financing contingencies. Understanding the current market conditions affecting their home, sellers will benefit from working with an experienced Agent who can guide them to closing with the best terms for them.