| Single-Family January-June 2022 | ||||
|---|---|---|---|---|
| Median Sale Price: | Average Sale Price: | Units Sold: | Newly Listed: | Days on Market: |
| $375,000 +13.6% | $431,529 +12.9% | 135 -30.8% | 191 -21.4% | 34 -60.0% |
| Condo January-June 2022 | ||||
|---|---|---|---|---|
| Median Sale Price: | Average Sale Price: | Units Sold: | Newly Listed: | Days on Market: |
| $302,001 +21.3% | $314,817 +0.5% | 9 -40.0% | 6 -50.0% | 26 -46.9% |
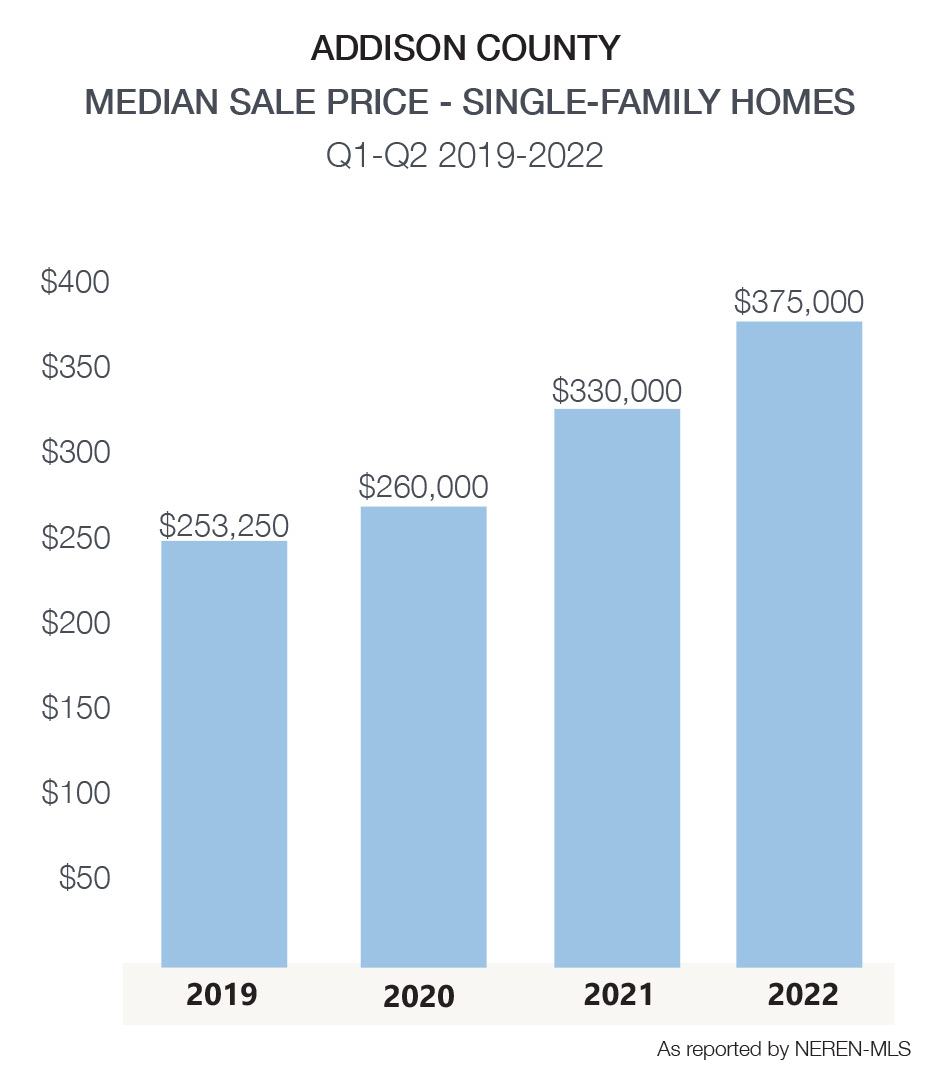
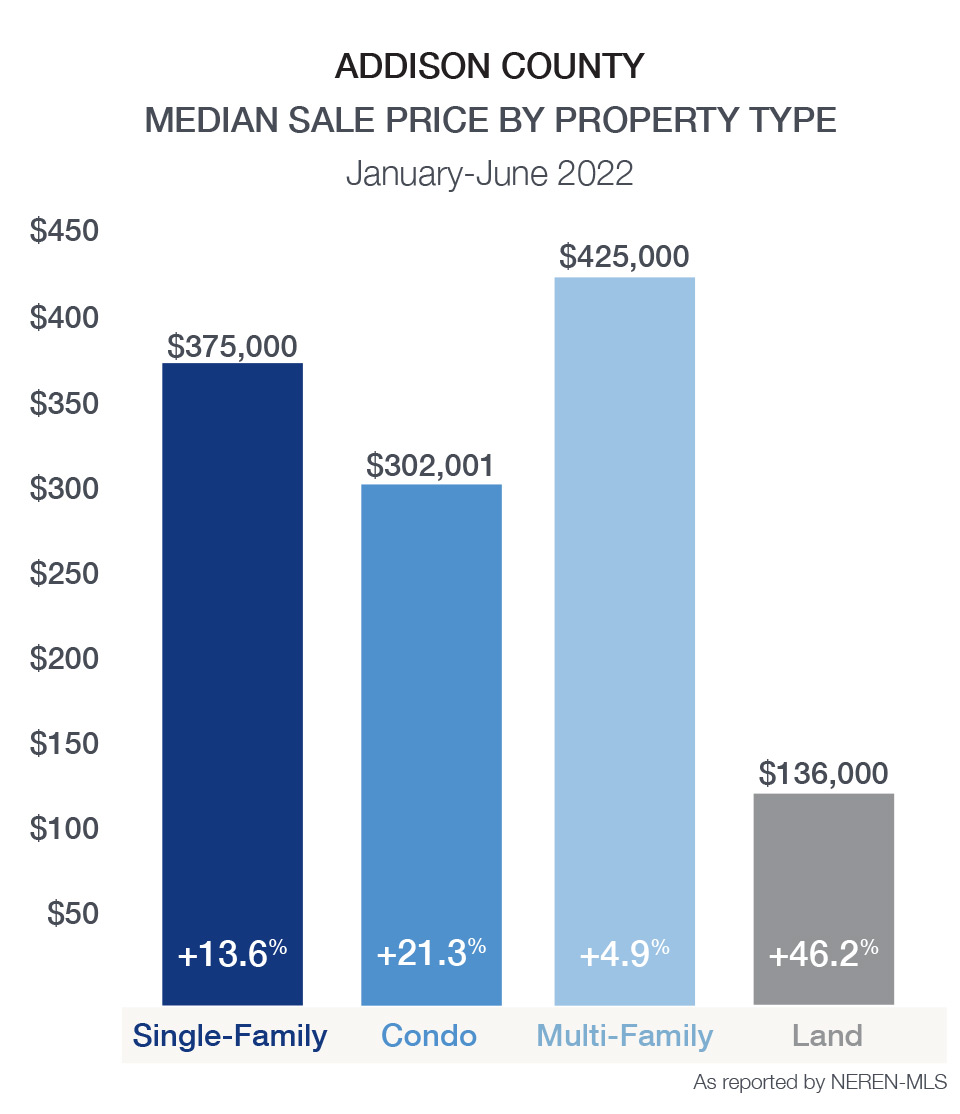
While Addison County felt a substantial downturn in sales throughout the first half of 2022, it’s important to note that 2021 represented historically high sales. Single family home sales declined 30% to 135 properties sold, and limited condominium units available limited transactions to 9, 40% less than in 2021. New inventory was soft, reflecting a 21.4% decline in single-family homes listed. Despite limited sales, prices appreciated by over 13.6%. Addison County was the beneficiary of interest from out-of-state buyers during the past two years as buyers sought more tranquil areas. The combination of charming towns like Vergennes, Bristol, and Middlebury surrounded by ample recreational, agricultural, and lakeshore property makes the region a desirable primary and second home market.
| MEDIAN SALE PRICE | VS 2021 | UNITS SOLD | VS 2021 | NEWLY LISTED | VS 2021 | Average DAYS ON MARKET | |
|---|---|---|---|---|---|---|---|
| Addison County Single-Family | $375,000 | 13.6% | $135 | -30.8% | $191 | -21.4% | 34 |
| Addison | $495,000 | -39.8% | 7 | 16.7% | 12 | 33.3% | 27 |
| Bridport | $339,500 | 42.5% | 6 | -40.0% | 6 | -45.5% | 14 |
| Bristol | $352,500 | 13.7% | 14 | -26.3% | 18 | 0.0% | 22 |
| Cornwall | $550,000 | 4.4% | 1 | -87.5% | 7 | 0.0% | 6 |
| Ferrisburgh | $493,500 | 45.4% | 14 | -22.2% | 17 | 21.4% | 19 |
| Goshen | $369,750 | 73.7% | 2 | -33.3% | 2 | 0.0% | 106 |
| Granville | $338,750 | 125.8% | 2 | -33.3% | 1 | -83.3% | 100 |
| Hancock | $262,500 | 118.8% | 2 | 0.0% | 2 | -33.3% | 6 |
| Leicester | $240,000 | -15.3% | 4 | -50.0% | 12 | -14.3% | 5 |
| Lincoln | $417,500 | 54.6% | 5 | 0.0% | 8 | 0.0% | 107 |
| Middlebury | $372,500 | -12.2% | 20 | -23.1% | 30 | -21.1% | 26 |
| Monkton | $409,000 | -2.6% | 9 | -30.8% | 14 | 0.0% | 52 |
| New Haven | $455,000 | -4.2% | 5 | -37.5% | 6 | -57.1% | 5 |
| Orwell | $451,250 | 37.7% | 6 | -40.0% | 8 | -46.7% | 58 |
| Panton | $310,000 | -25.0% | 5 | 25.0% | 8 | 60.0% | 14 |
| Ripton | - | 0.0% | - | 0.0% | 1 | -75.0% | - |
| Salisbury | $303,500 | 10.4% | 6 | -33.3% | 5 | -37.5% | 27 |
| Shoreham | $447,000 | 33.4% | 2 | -66.7% | 3 | -70.0% | 37 |
| Starksboro | $249,000 | -7.8% | 6 | -14.3% | 5 | -44.4% | 60 |
| Vergennes | $345,000 | 34.0% | 11 | -8.3% | 14 | -26.3% | 28 |
| Waltham | - | 0.0% | - | 0.0% | 1 | -66.7% | - |
| Weybridge | $375,000 | -10.9% | 4 | -50.0% | 8 | -20.0% | 10 |
| Whiting | $324,500 | 62.3% | 4 | 33.3% | 3 | 50.0% | 111 |