Explore the latest Washington County, Vermont real estate market trends, including home prices, sales activity, and insights from Coldwell Banker Hickok & Boardman.
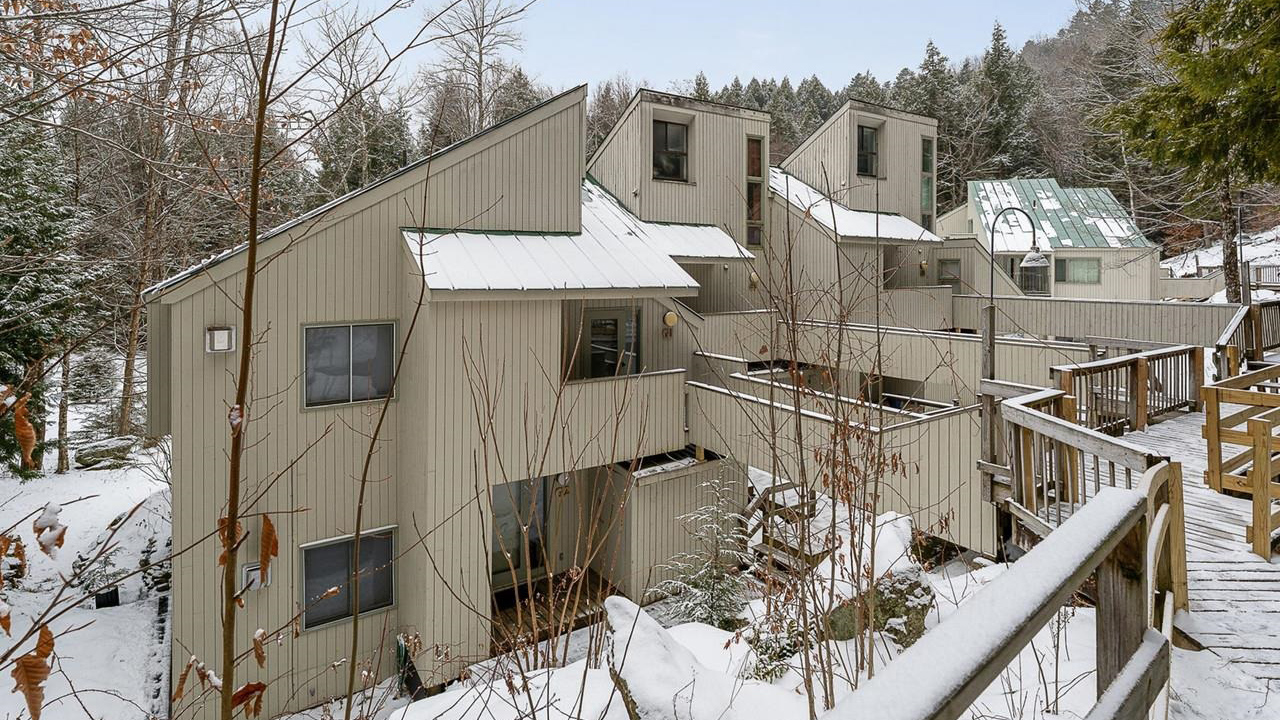
1027 Butternut Hill Road, Unit G-2, Waitsfield, VT ~ Stunning Design – Completely Remodeled Throughout! Enjoy the quiet wooded setting just minutes from the ski trails of Sugarbush and Mad River Glen, or the clear waters of Blueberry Lake.
Listen to 2026 Washington County Real Estate Market Report
Washington County’s 2025 real estate market reflects steady price growth with rising inventory and longer selling timelines, signaling a more balanced and deliberate environment. Single-family home prices increased at a sustainable pace, with the countywide median reaching $420,000, while sales volume rebounded. More homes came to market especially in mid-range price points easing pressure, though buyers are taking more time to compare options. Multi-family properties stood out, with pricing rising sharply due to limited supply and investor demand, while land values softened even as sales increased. Long-term trends remain positive, with prices nearly doubling since 2017, reinforcing the county’s underlying strength.
Single-Family January-December 2025
Median Sale Price:
Average Sale Price:
Units Sold:
Newly Listed:
Days on Market:
$420,000 | 3.1%
$509,203 | 1.5%
552 | 16%
722 | 13.3%
46 | 39.4%
Condos January-December 2025
Median Sale Price:
Average Sale Price:
Units Sold:
Newly Listed:
Days on Market:
$342,500 | 5.4
$382,422 | 8.7%
104 | -11.9%
144 | 3.6%
49 | 88.5%
Conditions vary by town, underscoring the importance of local insight. Barre City and Barre Town continue to lead in sales volume, with relative affordability, steady demand, and quicker market times. Montpelier remains a stable, consistent market with moderate price growth. Waitsfield and Warren reflect their lifestyle-driven appeal, with higher prices and longer days on market as buyers move more deliberately.
Waterbury remains in demand but is seeing slower decision-making as inventory grows. Overall, Washington County is balanced and highly local. Well-priced homes are selling, but buyers are no longer rushing. Success for sellers depends on realistic pricing and strong presentation, while buyers benefit from increased choice and negotiating room—especially outside the most competitive village and resort markets