As we review the real estate market results for 2022 and try to predict the market trends for 2023, one thing remains true – real estate is local. We will attempt to cut through the clutter and the sensational headlines to bring you a local and relevant perspective on real estate in northwest Vermont including Chittenden, Addison, Franklin and Grand Isle Counties.
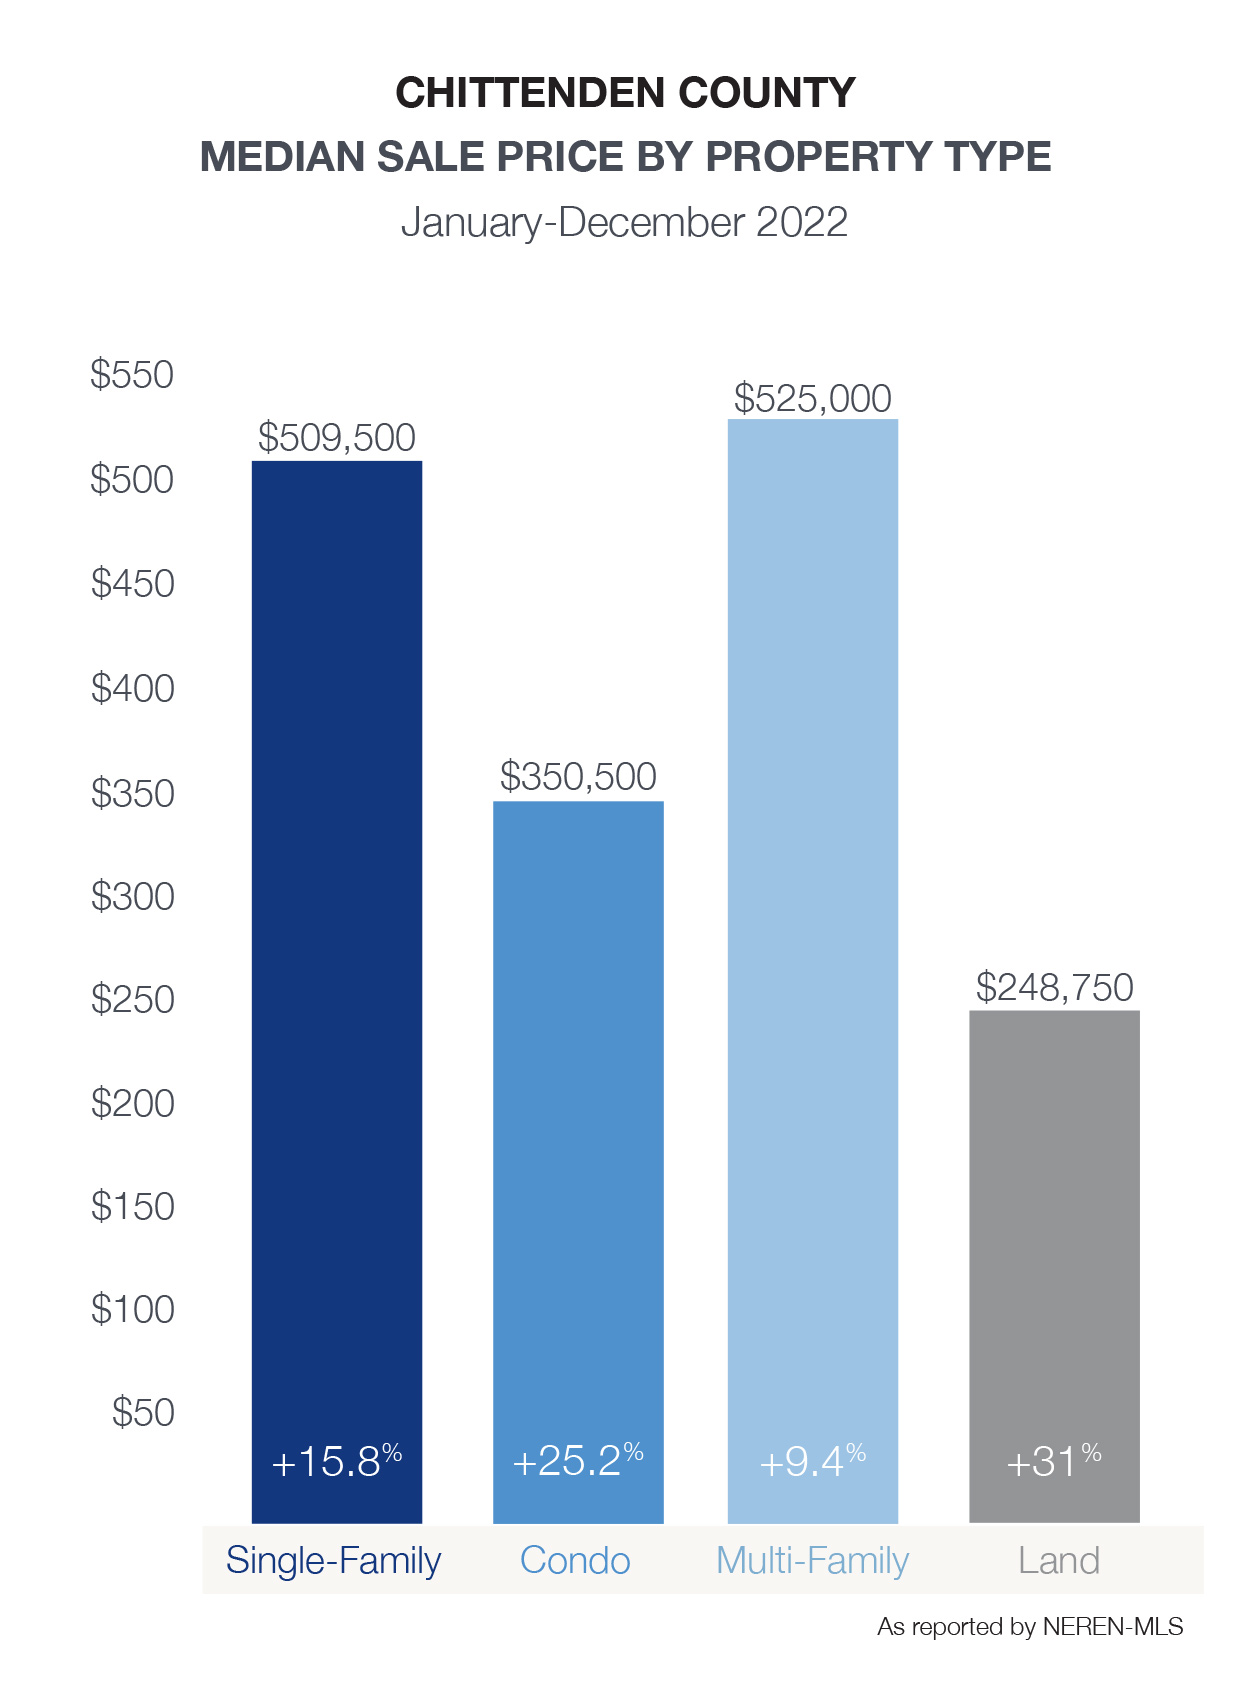
| Single-Family January-December 2022 | ||||
|---|---|---|---|---|
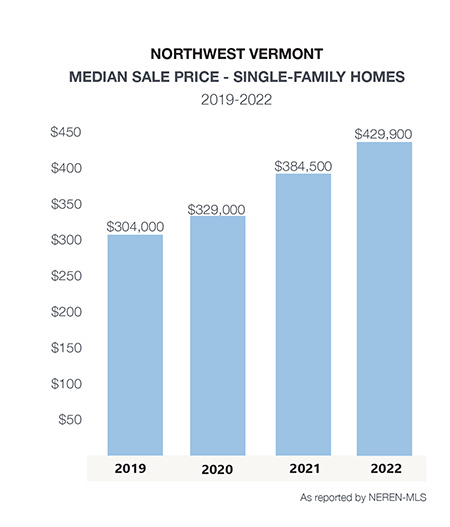
| Median Sale Price: | Average Sale Price: | Units Sold: | Newly Listed: | Days on Market: |
| $429,900 +11.8% | $501,166 +13.7% | 2,125 -20.3% | 2,371 -16.8% | 25 -34.2% |
| Condo January-December 2022 | ||||
|---|---|---|---|---|
| Median Sale Price: | Average Sale Price: | Units Sold: | Newly Listed: | Days on Market: |
| $340,000 +23.6% | $384,461 +21.2% | 706 -5.9% | 700 -12.9% | 21 -27.6% |
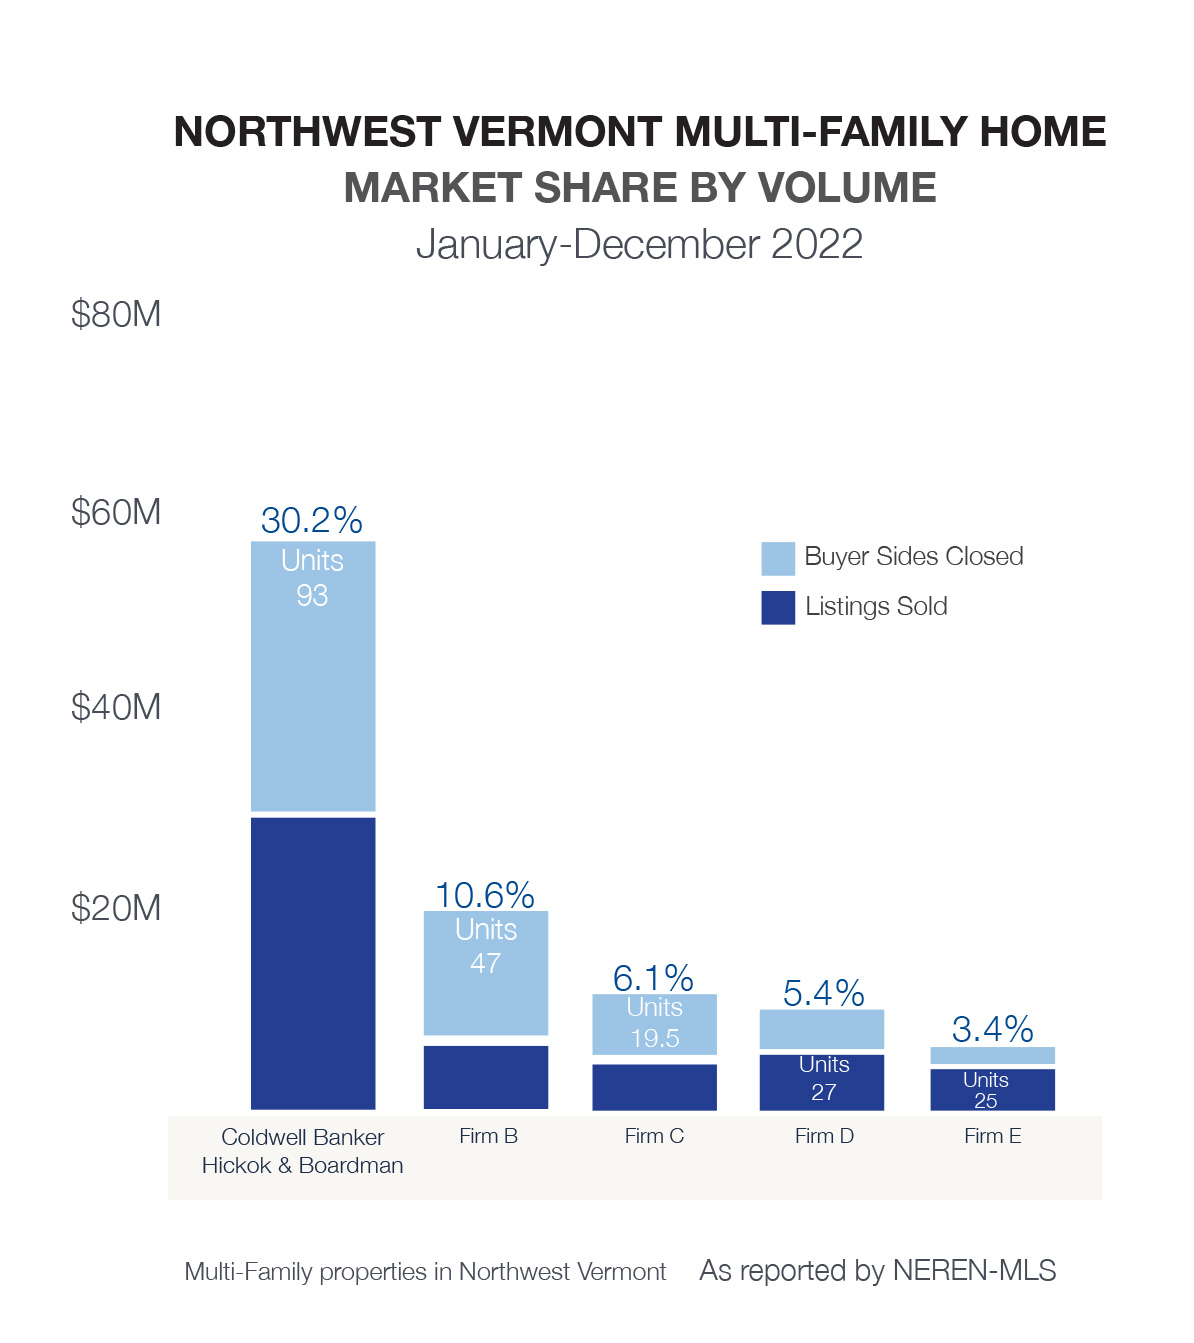
| Multi-Family January-December 2022 | ||||
|---|---|---|---|---|
| Median Sale Price: | Average Sale Price: | Units Sold: | Newly Listed: | Days on Market: |
| $490,000 +14.0% | $510,618 -5.4% | 183 -25% | 204 -32.9% | 54 -8.5% |
| Land January-December 2022 | ||||
|---|---|---|---|---|
| Median Sale Price: | Average Sale Price: | Units Sold: | Newly Listed: | Days on Market: |
| $138,500 +32.2% | $210,407 +23.1% | 234 -27.3% | 322 -14.1% | 154 -35% |
In summing up 2022, the story of the year was mortgage interest rates. Mortgage rates ended 2021 and opened 2022 just below 3% on a 30-year fixed rate, conventional loan. By mid-year, rates doubled, eclipsing 7.0%. By December, they had settled at 5.875% to the low 6% range. Inflation was the biggest driver of the rate increases as the Federal Reserve took action and began hiking the Fed Funds rate. Investors are starting to breathe a sigh of relief that the worst inflation may be behind us, but with the Consumer Price Index (CPI) still higher than the Fed prefers, mortgage rates may stay in the high 5% to low 6% range through most of 2023, with a modest adjustment not expected until Q4 of 2023.
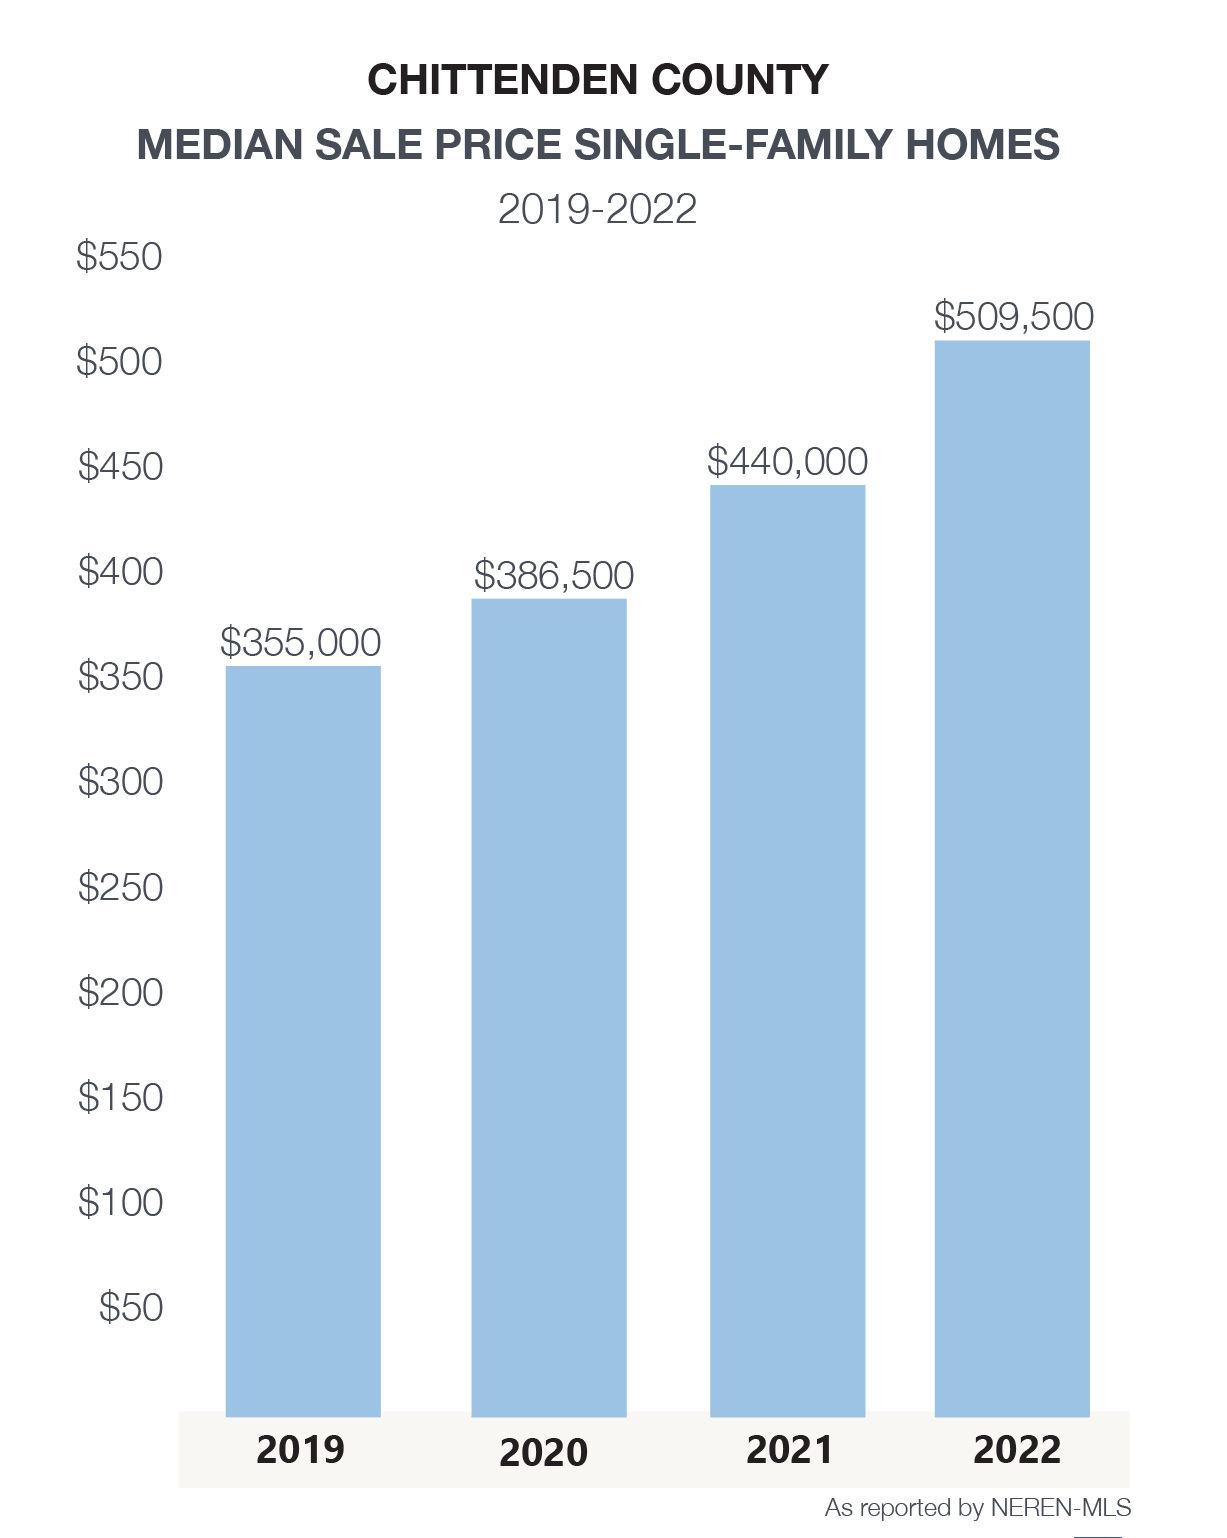
What does that mean for buyers interested in purchasing a home? When you find a home that you like, buy it! Interest rates will likely never return to the 3% range we have benefited from over the past few years. The median sale price of homes has been increasing and will continue to do so in 2023 (although not at the rate of the past 3 years). And, inventory remains limited. The saying we keep hearing is “Marry the home, date the rate!” Many buyers are now considering adjustable-rate mortgages (ARMs) to keep their payments a bit lower in the short term. If you commit to a home, you will have the opportunity to refinance if and when mortgage interest rates go down.
 The biggest factor impacting the real estate market both locally and nationally is the deficit of inventory. Nationally, this deficit is estimated to be 3.8 million homes. Locally, the Vermont Futures Project has estimated the immediate deficit to be 5000 homes; although this may be underestimating the problem. We are not digging our way out of the problem as we continue to “under build.” New construction plays a critical role; however, it is not meeting demand for a variety of reasons including labor shortages, construction costs, and land development costs. In northwest Vermont, there were double digit declines in the number of closed sales across all property types (residential, multi family, and land) in 2022. These declines do not reflect consumer demand but are a direct result of the lack of properties available for sale. In the past 2 years, the number of single-family homes and condos for sale monthly, has dropped 28%.
During December of 2022, there were only 384 properties available across northwest Vermont – compared to 659 in December of 2020.At the peak of the traditional 2022 real estate season, there were only 694 residential properties for sale with 330 going Under Contract. This calculates to only 2 months’ supply of inventory on the market – continuing a strong seller’s market. A balanced market (not a seller’s nor buyer’s market) would have approximately 4-6 months’ supply of inventory for sale. The number of homes for sale won’t increase significantly in 2023 as many homeowners do not want to lose their current low mortgage rate. Sellers will continue to move for life transitions such as career changes, family status changes, or aging out of a home.
 In 2023, sellers should adjust their expectations. With higher interest rates, there still are buyers out there but not as many as 2021 and early 2022. Sellers will still reap the benefits of strong equity positions in their homes. Offers may come with inspection and financing contingencies. Understanding the current market conditions affecting their home, sellers will benefit from working with an experienced Agent who can guide them to closing with the best terms for them.
A stable and uneventful market is what we need over the next few years. Experts are predicting modest price growth in 2023. In northwest Vermont, we estimate a 3 – 5% increase in prices depending on the market segment. Properties priced below $600,000 and properties in move-in condition will continue to be in strong demand. The shock of the recent interest rate increases will give way to acceptance by buyers.
Millennials and Gen Z view real estate to be a means to build wealth as well as contribute to their quality of life. A recent Chase Home Lending survey found that 2 in 5 first time home buyers were living with family in order to save for a home. 58% of those surveyed think they will be ready to buy in the next 12 months. Indeed, home ownership continues to be the American dream.