2023 Mid Year Market Report

450 Red Truck Lane, Charlotte, VT ~ Enjoy breathtaking views of the Green Mountains from this exceptional 47-acre property. If you’re looking for a private country escape that’s still close to all amenities, hobby farm, family compound, or equestrian estate – this property fits the bill!

We have reached the mid-point of 2023 and are taking stock of how the market has fared thus far.  It is an opportunity to reassess the economic climate, the real estate market, which trends will continue, and what we see changing. One thing remains constant – real estate is local.  Our goal is to provide a perspective on real estate here in northwest and central Vermont.

Single-Family January-June 2023
Median Sale Price:Average Sale Price:Units Sold:Newly Listed:Days on Market:
$450,500 +7.0%$514,279 +2.7%743 -19.1%1064 -16.0%33 +17.9%
Condos January-June 2023
Median Sale Price:Average Sale Price:Units Sold:Newly Listed:Days on Market:
$355,000 +6.0%$411,082 +8.3%257 -25.5%337 -18.0%16 -33.3%
Multi-Family January-June 2023
Median Sale Price:Average Sale Price:Units Sold:Newly Listed:Days on Market:
$507,500 +2.6 %$564,522 +4.5 %50 -52.8 %76 -46.5 %48 -2.0%
Land January-June 2023
Median Sale Price:Average Sale Price:Units Sold:Newly Listed:Days on Market:
$144,500 -2.7 %$204,327 -3.3 %92 -28.1 %162 -14.7 %130 -18.2%

After 2 unprecedented years, we are experiencing the “new normal” and that includes a return of seasonality in the market. In 2023, demand continues to be strong. Despite inflation and the Federal Reserve’s intention to fight it with a series of historically aggressive rate hikes since March 2022, consumers have been resilient.

On July 26, the current benchmark lending rate was raised again by a quarter point. With the Fed’s goal of a 2% inflation rate, many anticipate another quarter point increase later this year. Inflation is now closer to 4%, a marked improvement from the peak of 9.1%.  The impact on mortgage rates has been to more than double rates from a historic low of approximately 3%.

With 10 months of mortgage rates in a well confined 6-7% range, it appears that many buyers have adjusted. “How can I make the numbers work?” has replaced “Can I afford to buy?” They come to the market in a much stronger position – with higher credit scores, strong savings, and a strong ability to weather markets.  Even if, for many, it meant moving “home” with parents for some time.

As many buyers have stayed active in the market, the limited inventory –not demand– is what is compressing sales.  New listings year to date are down from last year 15-20%, with some product segments further outliers.  The decline in new listings compounds the issue of limited inventory. It also drives up prices.

Fewer sales in 2023 have not negatively affected values. Prices are still on an upward trajectory although at a slower rate than last year.  This substantiates that while the market is not as frenzied as before, there is still demand for properties, which is driving prices higher. When there are fewer new properties being listed for sale, it exacerbates the supply shortage and can further constrain the choices available to both buyers and homeowners looking to move. As prices continue to grow, affordability becomes a primary concern.  There is little in our local market that suggests prices will decline anytime soon, of course, if not impacted by some large-scale event.

Many of our buyers are still finding success in today’s market.  We have also assisted many sellers who are benefiting from recent price growth and their substantially strengthened equity positions.  Homeowners are now making lifestyle moves that may have been delayed by the pandemic. By getting real time updates on market values and understanding the dynamics of the real estate market, buyers and sellers can position themselves to make well-informed decisions that align with their needs and goals.

In a survey in May 2023 Freddie Mac found, 18% of buyers say they are likely to buy a home in the next 6 months; 16% of homeowners say they are likely to sell in the next 6 months.  In the pre-pandemic market, those numbers were in the 8-10% range.  This is a solid indicator of a desire to move on and the continuance of a solid market for the near future.

Recent national news reported that new construction is growing, offering more options for buyers and sellers.  Builders recognize the inventory shortage and are ramping up productivity as much as possible. Locally this pattern is somewhat compressed. Challenges like permitting and labor shortages stifle necessary and desired growth.  Development is strongest in the southern part of the US – where trends show that Americans are moving, and affordability is better.

Demonstrating the demand, one of our local lenders, New England Federal Credit Union reports a significant increase in construction loans. Building a new home provides a viable solution while resale listings are limited. However, the process in some cases may be lengthier and pricier than many buyers are prepared for.  Neighborhood developments such as Hillside East in South Burlington provide the option to customize many features in your new home while working with a builder who offers turnkey solutions within a reasonable time frame.

In recent years cybercrimes and consumer fraud have been rising in frequency. Real estate transactions have increasingly been a target. Be cautious when responding to emails to wire funds to parties in a transaction.  The latest scam across the nation, as well as right here in Vermont, are fraudsters impersonating owners of vacant land, attempting to sell it quickly, at below market prices.   If something seems too good to be true, it likely is. You can read more about this later in the report in our section on Land sales.

Overall, the real estate market remains competitive due to the combination of limited inventory, price growth, declining new listings, and affordability concerns. To best navigate this market successfully, it is crucial for both buyers and sellers to be well-informed about the current conditions and trends and be prepared to adapt their strategies accordingly. Our well-skilled and experienced agents can provide the guidance you need.

Vermont Mortgage Update


NMLS# 446767
866.80.LOANS


As expected, Spring brought about an increase in activity. Purchases and pre-approvals make up 78% of the mortgage applications at New England Federal Credit Union (NEFCU). Home equity loans have seen significant growth in the past year as homeowners capitalize on their equity position, while protecting their low first mortgage interest rate.

According to Freddie Mac, the 30-year fixed rate end the second quarter at 6.71%. In this purchase market, borrowers are growing accustomed to the higher rates. Loan Officers are hard at work issuing and updating pre-approval letters, as borrowers need to act quickly in this competitive market. Amidst the increased rate environment, we saw a 15% increase in the average loan amount in 2022, as compared to an average annual increase of 4% when considering data from the past 30 years.

NEFCU’s portfolio has seen a significant increase in Construction lending. Historically, Construction loans 
make up 1-2% of overall production and are currently over 5%. There has also been an increase in what the industry considers non-conventional housing. This includes off-grid properties, yurts, and tiny homes. For lenders, this can introduce complications due to conventional loan requirements. In Vermont, local lenders such as NEFCU are creating portfolio products to meet the unique housing needs of our state.

Affordable housing is a focus at the state and national level. Nationally, this comes from the Duty to Serve initiative. This is a requirement for Fannie Mae and Freddie Mac to facilitate a secondary mortgage market on housing for low, to moderate-income families. Within the Duty to Serve, we are seeing a focus shift to historically underserved markets: manufactured homes, affordable housing preservation, and
rural housing. 

At the state level, the Vermont Mortgage Bankers Association joined other associations like the Vermont
Association of Realtors to share the story of the housing crisis as legislators worked on S100, the Omnibus Housing Bill. In addition to zoning reform, the bill gives continued to support to agencies like the  Vermont Housing Finance Agency, which works with participating lenders statewide to administer loan programs and grants to support homeownership. NEFCU has seen a significant increase in borrowers benefitting from these programs; VHFA loans increased 5-fold thus far in 2023 compared to 2022. NEFCU further supports affordable housing with a portfolio down payment assistance program as well as partnerships with Community Lending Trusts throughout the state.

As we move through the rest of 2023, the focus will remain on Duty to Serve, housing affordability and how to help the most borrowers achieve homeownership.

NEFCU Disclaimer: The information in this report is for informational purposes only and does not represent an offer or commitment to provide any product or service. Any rate quotes, prices or the physical information included have been obtained from sources believed to be reliable, but we do not guarantee their accuracy or completeness. Any mentions of third-party names, products, and services are for referential purposes only and are not meant to imply any sponsorship, endorsement, or affiliation unless otherwise noted. This information is based on current market conditions and is subject to change without notice

Chittenden County Market Results

Hillside is a neighborhood in South Burlington, Vermont, now offering 100% carbon-free, climate resilient new construction homes in Hillside East, with all the conveniences of an established community. Go To HillsideVT.com

Single-Family January-June 2023
Median Sale Price:Average Sale Price:Units Sold:Newly Listed:Days on Market:
$542,173 +7.3 %$598,638 -1.7 %402 -17.1 %552 -16.4 %28 +47.4%

Condos January-June 2023
Median Sale Price:Average Sale Price:Units Sold:Newly Listed:Days on Market:
$360,000 +5.9%$418,575 +8.5%234 -25.2%297 -21.0%17 -22.7%

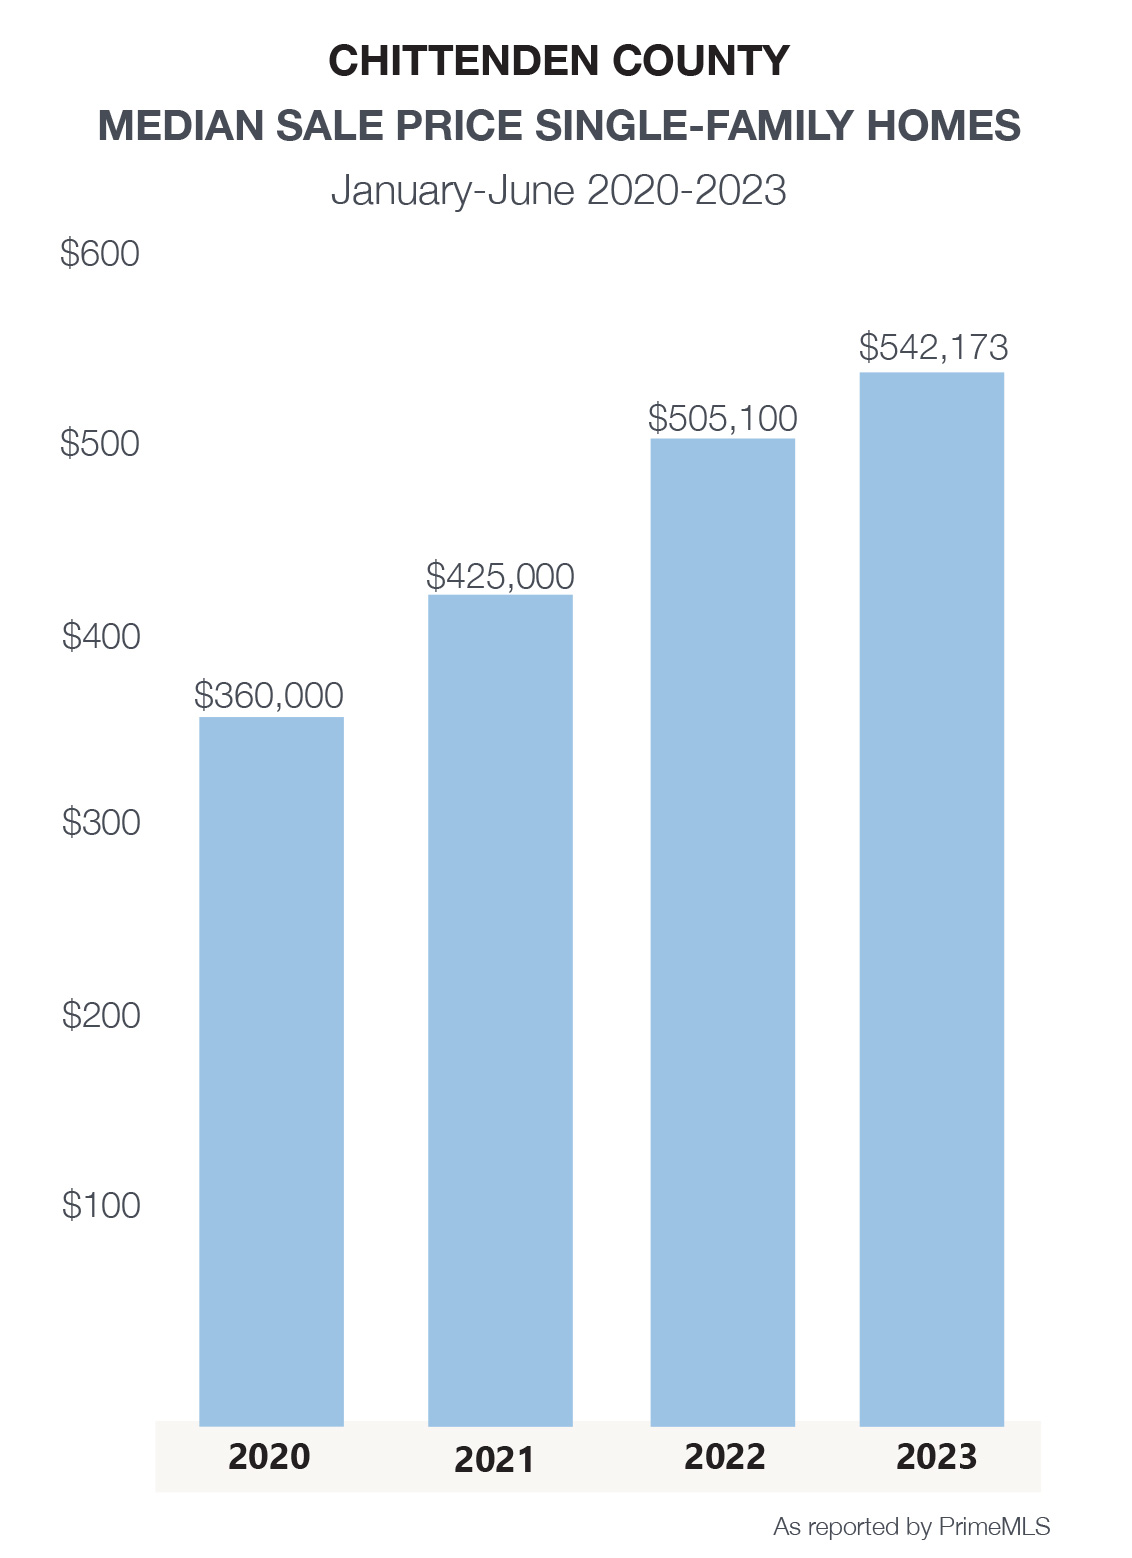
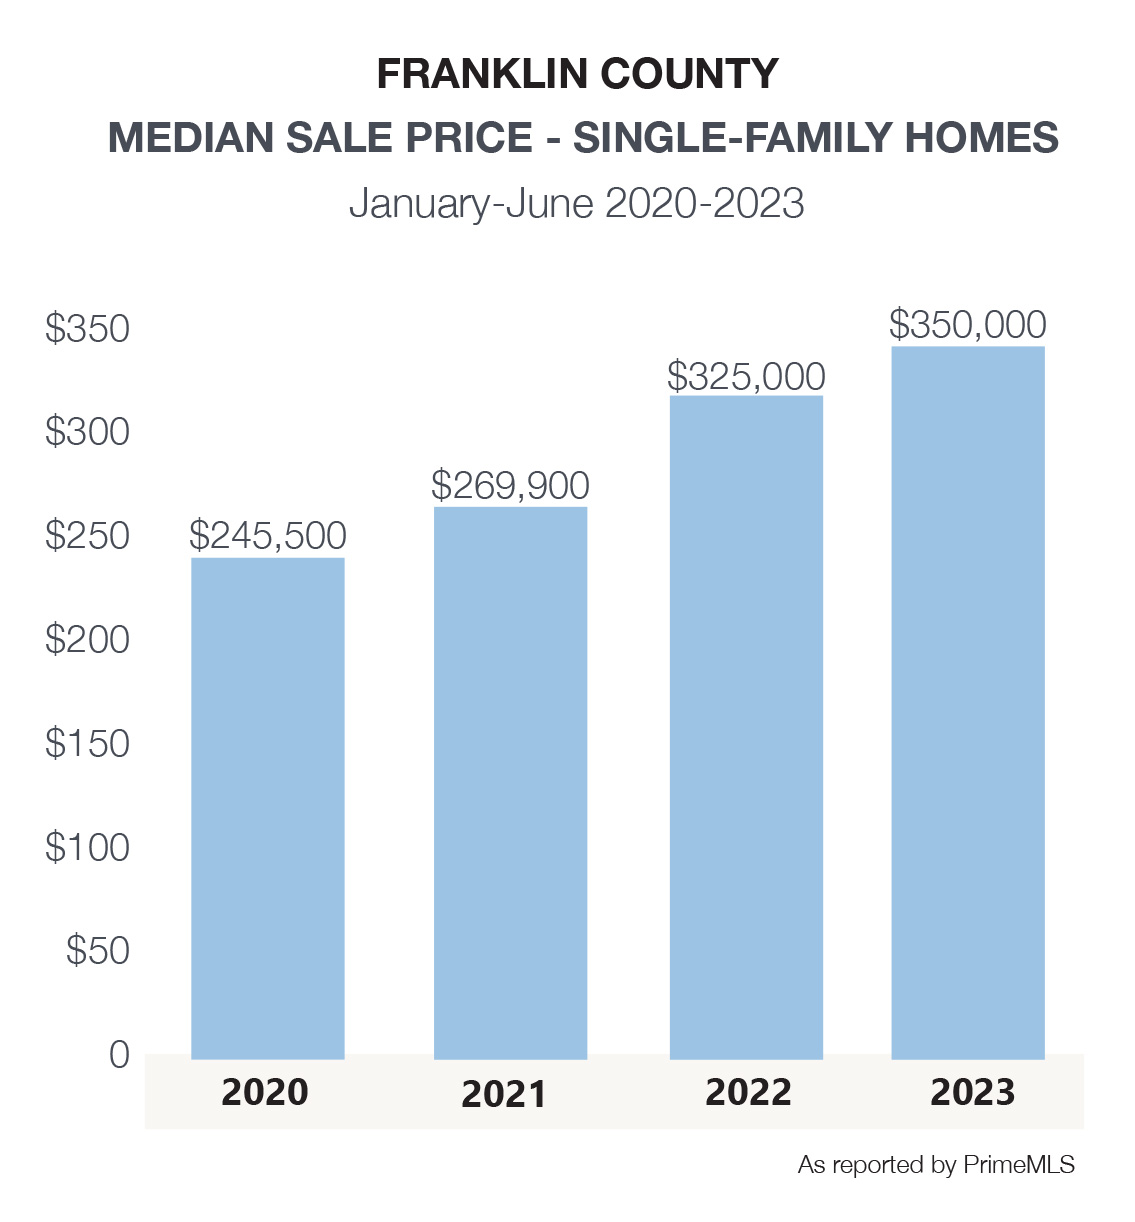
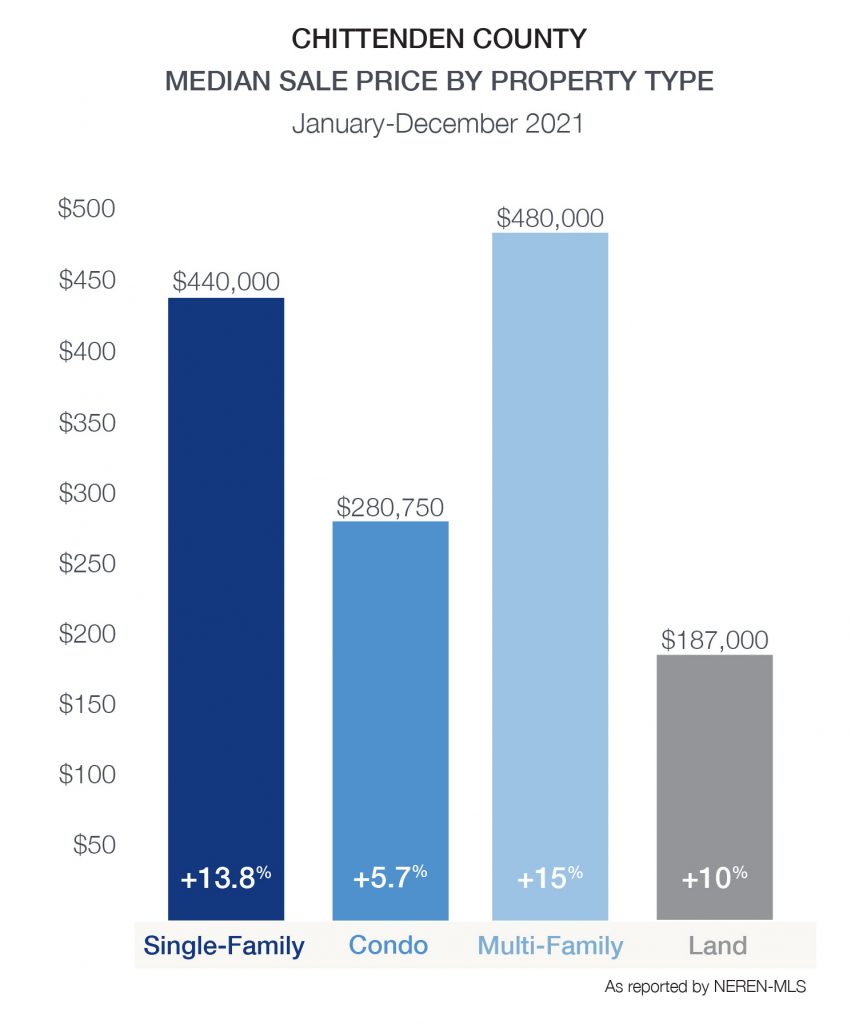
While prices for single family homes have increased across the county by nearly 51% since mid-year 2020, growth has moderated in 2023 at a 7% increase.  Homeowners have seen increased equity over the past few years, while benefiting as the largest portion of their living expenses – their mortgage – remained stable. Year to date, although buyer demand remained strong, a drop of 16% in new listings resulted in a decline in closed sales.  Some buyers, many who paused searches in the second half of 2022 due to rising interest rates, have reentered the market this spring to face competitive offers.  This is more frequent in the more affordable price ranges. The decline in new listings is also beginning to moderate as lifestyle factors encourage many sellers to maximize gains and make moves long delayed since the pandemic.

Hillside East in South Burlington introduced one of the nation’s first 100% fossil fuel and carbon-free, climate resilient neighborhoods in the spring. With construction underway, a variety of single family and town home styles are available for reservation in the already established community.  South Village, also in South Burlington, is wrapping up development with the last lots under construction.

In Chittenden County, Coldwell Banker Hickok & Boardman agents represented clients in more than 1 in 4 sales.  Buying or selling your home is a big deal – the experience and results your Agent and real estate brokerage offer should be, too.

MEDIAN SALE PRICEVS 2022UNITS SOLDVS 2022NEWLY LISTEDVS 2022DAYS ON MARKET
Chittenden County Single-Family$542,173 7.3%402-17.1%552-16.4%28
Bolton$542,000 -23.0%3200.0%433.3%38
Burlington$610,000 11.0%69-16.9%76-37.7%34
Charlotte$550,000 -28.0%7-56.3%13-40.9%44
Colchester$512,750 3.0%42-8.7%7638.2%24
Essex$483,750 8.0%62-25.3%74-16.9%28
Hinesburg$542,000 -14.0%3-82.4%15-55.9%9
Huntington$250,035 -29.0%2-81.8%3-80.0%22
Jericho$590,000 -6.0%11-15.4%2414.3%11
Milton$425,000 4.0%4132.3%4817.1%39
Richmond$477,250 5.0%8-11.1%1344.4%25
Shelburne$865,500 8.0%20-42.9%34-38.2%21
South Burlington$626,225 18.0%7222.0%959.2%19
St. George$675,250 48.0%4300.0%5-16.7%34
Underhill$540,000 -10.0%912.5%1536.4%25
Westford$565,500 34.0%7-12.5%7-36.4%12
Williston$611,000 1.0%31-29.6%34-45.2%51
Winooski$360,000 -8.0%11-45.0%16-5.9%7

MEDIAN SALE PRICEVS 2022UNITS SOLDVS 2022NEWLY LISTEDVS 2022DAYS ON MARKET
Chittenden County Condo$360,000 5.9%234-25.2%297-21.0%17
Bolton$283,000 -3.6%3-25.0%3-25.0%4
Burlington$376,500 -4.7%44-18.5%51-37.0%15
Charlotten/a0.0%n/a0.0%n/a0.0%n/a
Colchester$394,950 16.2%20-46.0%31-22.5%32
Essex$362,450 13.3%36-35.7%53-22.1%10
Hinesburg$288,000 -31.8%1-83.3%2-75.0%4
Jericho$381,250 50.7%4300.0%5400.0%6
Milton$240,000 -11.1%5-44.4%14-26.3%4
Richmondn/a0.0%n/a0.0%n/a0.0%n/a
Shelburne$597,211 53.1%15114.3%16128.6%68
South Burlington$335,000 1.5%67-28.0%77-22.2%12
Williston$422,500 5.6%28-20.0%31-16.2%10
Winooski$352,000 5.9%1110.0%1427.3%13

Addison County Market Results

724 Delong Lane, Shoreham, VT ~ This well-maintained log home sits on over 1 acre, with 480 feet of lake frontage on Lake Champlain.

Single-Family January-June 2023
Median Sale Price:Average Sale Price:Units Sold:Newly Listed:Days on Market:
$376,000 +0.3 %$467,149 +8.3 %121 -10.4 %170 -11.0 %36 +5.9%

Condos January-June 2023
Median Sale Price:Average Sale Price:Units Sold:Newly Listed:Days on Market:
$323,000 +7.0%$381,438 +21.2%8 -11.1%8 +33.3%14 -46.2%

The real estate market in Addison County is not immune to the trends seen across other counties in this report although at a more moderate pace. The number of single-family homes sales declined by only 12 units, while the number of new listings on the market dropped by 17 units.  With a small number of transactions in many towns, the data can show dramatic swings in one direction or the other.

Bristol, Ferrisburgh, Middlebury, Monkton, Orwell, and Vergennes proved the most popular with the greatest number of sales, however with far fewer new listings as compared to last year at this time.  Ferrisburgh, in the northern part of the county, posted a median sale price of $529,000 – significantly higher than the county average of $376,000.

While there are few condominium sales in the county, the available parcels of land for sale increased by 21% during the first half.  This resulted in 30 closed sales, the highest number of land sales in the region.

MEDIAN SALE PRICEVS 2022UNITS SOLDVS 2022NEWLY LISTEDVS 2022DAYS ON MARKET
Addison County Single-Family$376,000 0.3%12157.1%170-11.0%36
Addison$529,000 6.9%30.0%7-41.7%82
Bridport$253,260 -25.4%6-14.3%13116.7%16
Bristol$366,250 3.9%1240.0%14-22.2%15
Cornwall$525,000 -4.6%5-28.6%814.3%77
Ferrisburgh$529,000 7.2%10n/a16-5.9%27
Goshenn/a0.0%n/a0.0%1-50.0%n/a
Granville$411,000 21.3%2-50.0%3200.0%82
Hancock$376,000 43.2%10.0%5150.0%10
Leicester$444,000 85.0%4-60.0%3-75.0%120
Lincoln$666,250 59.6%2-20.0%2-75.0%45
Middlebury$367,500 -1.3%160.0%20-33.3%22
Monkton$385,000 -5.9%90.0%12-14.3%4
New Haven$485,000 6.6%566.7%5-16.7%17
Orwell$299,500 -33.6%10-8000.0%1137.5%46
Panton$335,000 8.1%10.0%3-62.5%3
Ripton$450,510 0.0%3-50.0%3200.0%188
Salisbury$275,000 -9.4%3150.0%980.0%34
Shoreham$415,000 -7.20%50.0%6100.00%42
Starksboro$227,500 -8.60%60.0%860.00%39
Vergennes$350,000 1.50%110.0%12-14.30%26
Waltham$499,500 0.00%2253200.00%6
Weybridge$502,000 33.90%5n/a6-25.00%11
Whitingn/an/an/an/an/an/an/a

Franklin County Market Results

1019 Highland Drive, Montgomery, VT ~ Enjoy all 4 seasons in this secluded Chalet only 6 miles to Jay Peak Resort!.

Single-Family January-June 2023
Median Sale Price:Average Sale Price:Units Sold:Newly Listed:Days on Market:
$350,000 +7.7%$358,532 +4.0%182 -26.9%275 -17.2%45 +45.0%

Single-Family January-June 2023
Median Sale Price:Average Sale Price:Units Sold:Newly Listed:Days on Market:
$285,000 +11.8%$301,786 -6.3%14 -39.1%31 +29.2%8 -81.4%

The first half of 2023 saw a decline of 27% in closed sales for single-family homes in Franklin County, compared to the same period last year. Additionally, new listings for single-family homes in the county dropped by 17% year-over-year, contributing to the limited inventory and increased competition among buyers.

Despite the challenges faced by the single-family home market in Franklin County, the median sale price for homes increased by around 8% compared to 2022, demonstrating that demand remains strong in this segment of the market.  Among the counties included in this report, the median price of $350,000 positions Franklin as the most affordable. Not only is it easily accessible to I-89, but Franklin County also a variety of property types such as single family, condos, multi-family, and land for buyers to consider.

Fairfax, Georgia, Swanton post some of the highest number of sales in the county – along with an increase in the median sale price, indicating that these areas remain attractive to buyers.

MEDIAN SALE PRICEVS 2022UNITS SOLDVS 2022NEWLY LISTEDVS 2022DAYS ON MARKET
Franklin County Single-Family$350,000 7.7%182-26.9%275-17.2%45
Bakersfield$397,000 41.3%4-55.6%5-16.7%22
Berkshire$232,250 -28.5%4-60.0%4-60.0%107
Enosburg$260,000 10.6%7-46.2%14-33.3%98
Fairfax$478,750 19.7%3228.0%33-5.7%21
Fairfield$250,000 -41.2%566.7%8100.0%30
Fletcher$625,000 30.9%1-50.0%650.0%6
Franklin$352,000 40.5%7-12.5%9-50.0%133
Georgia$444,750 9.8%14-26.3%21-12.5%20
Highgate$370,000 16.1%9-50.0%21-19.2%142
Montgomery$404,000 6.3%2-84.6%8-46.7%87
Richford$190,000 -16.5%1475.0%2116.7%58
Sheldon$320,000 60.0%620.0%1122.2%11
St. Albans$340,000 -9.3%49-31.0%73-15.1%22
Swanton$305,000 6.6%28-37.8%41-26.8%54

Lamoille County Market Results

Single-Family January-June 2023
Median Sale Price:Average Sale Price:Units Sold:Newly Listed:Days on Market:
$492,350 +13.2%$701,358 +2.8%95 -25.8%147 -29.3%49 -5.8%

Condos January-June 2023
Median Sale Price:Average Sale Price:Units Sold:Newly Listed:Days on Market:
$486,500 +14.5 %$942,056 +47.0 %52 -16.1 %58 -35.4 %96 +20.0%

Driven by the staggering median sale price of $1,210,000 in Stowe, Lamoille County has the 2nd highest median price across the counties in the report. Buyer demand, exceeding the inventory of single-family homes and condos available for sale, drove prices 13-14% higher than during the first half of 2022. In addition to Stowe, Cambridge and Morristown posted the greatest number of both single-family homes and condos sales in the county. 

MEDIAN SALE PRICEVS 2022UNITS SOLDVS 2022NEWLY LISTEDVS 2022DAYS ON MARKET
Lamoille County
Single-Family
$492,350
13.2%95-25.8%147-29.3%49
Belvidere$360,000 7.5%1-66.7%40.0%3
Cambridge$360,000 5.9%150.0%19-26.9%46
Eden$265,000 2.4%716.7%1122.2%47
Elmore$750,000 101.9%2-75.0%350.0%33
Hyde Park$300,000 -31.0%7-58.8%11-54.2%41
Johnson$389,500 3.3%6-33.3%12-42.9%84
Morristown$425,000 8.9%21-34.4%34-29.2%33
Stowe$1,210,000 -4.3%31-3.1%41-32.8%58
Waterville$344,500 -49.7%2100.0%4-20.0%6
Wolcott$365,000 53.4%3-40.0%80.0%80

MEDIAN SALE PRICEVS 2022UNITS SOLDVS 2022NEWLY LISTEDVS 2022DAYS ON MARKET
Lamoille County Condos$486,50014.5%52-16.1%58-35.4%96
Cambridge$277,500 158.1%8-42.9%8-55.6%202
Morristown$280,000 -8.2%350.0%30.0%11
Stowe$959,804 53.6%41-10.9%42-31.2%82

Grand Isle County Market Results

Terrapin Lane, Alburgh, VT ~ Nestled between the shores of Lake Champlain & the greens of The Alburgh Golf Links lies this new country community.

Single-Family January-June 2023
Median Sale Price:Average Sale Price:Units Sold:Newly Listed:Days on Market:
$394,000 +13.7%$517,868 +23.5%38 -28.3%67 -20.2%27 +47.1%

Condos January-June 2023
Median Sale Price:Average Sale Price:Units Sold:Newly Listed:Days on Market:
$425,000 n/a$425,000 n/a1 n/a1 -80.0%7 n/a

The Grand Isle real estate market has bounced back after a slow start to 2023. While new listings of single family homes coming on the market dropped by 20% over the same period last year, the 1st quarter of the year was down 57%. Still, this limited the options available for buyers as the spring and summer season approached.

The median sale price of $394,000 is a 14% increase year-over-year, indicating continued strong demand in this segment of the market.  With homes selling quickly in this area – the average number of days on the market is just 27 days –  it appears that buyers are ready, willing, and able to make a move when the right home becomes available.

The results of the first half primarily reflect the seasonality of Grand Isle County’s real estate market – which is heavily influenced by sales of lakefront homes.  Notably, only 1 condominium sale was reported in this period.

MEDIAN SALE PRICEVS 2022UNITS SOLDVS 2022NEWLY LISTEDVS 2022DAYS ON MARKET
Grand Isle County Single-Family$394,000 13.7%38-28.3%67-20.2%27
Alburgh$265,000 2.3%13-43.5%25-7.4%27
Grand Isle$400,000 -2.4%90.0%16-5.9%31
Isle La Motte$672,500 110.2%4-20.0%9-30.8%52
North Hero$420,000 -5.6%6-45.5%8-52.9%16
South Hero$635,000 -9.3%620.0%9-10.0%16

Washington County Market Results

213 Kneeland Hill Road, Waterbury, VT ~ Nestled in the hills between Waterbury Reservoir and Worcester Mountain Range, this stunning home faces east for a morning glow and stunning mountain scenery.

Single-Family January-June 2023
Median Sale Price:Average Sale Price:Units Sold:Newly Listed:Days on Market:
$360,000 +15.5%$436,342 +15.7%179 -27.2%271 -15.3%41 -2.4%

Condos January-June 2023
Median Sale Price:Average Sale Price:Units Sold:Newly Listed:Days on Market:
$313,500 +14.0%$351,657 -0.6%50 -18.0%70 -6.7%24 0%

Home to the state capital of Montpelier, with Barre being the most populous municipality, the Washington County real estate market is robust yet challenging.  A drop of 15% in homes available for sale failed to meet buyer demand resulting in a 27% decline in closed sales.  As a result, the median sale price jumped by nearly 16%.  As we write this report, we are saddened by the flood damage sustained throughout much of the county during severe, July storms.  Homes and businesses alike are cleaning up and hoping to rebuild.  The short- and long-term effects of this devastation have yet to be realized.

MEDIAN SALE PRICEVS 2022UNITS SOLDVS 2022NEWLY LISTEDVS 2022DAYS ON MARKET
Barre$279,500 17.4%58-40.2%77-24.5%42
Berlin$385,000 10.0%7-36.4%100.0%21
Cabot$90,050 -86.1%1-83.3%5-28.6%23
Calais$570,000 56.2%50.0%12100.0%31
Duxbury$600,025 83.2%2-66.7%40.0%86
East Montpelier$360,000 -15.3%2-77.8%12-20.0%3
Fayston$636,000 -7.5%3-62.5%90.0%9
Marshfield$504,000 21.5%4-20.0%5-44.4%49
Middlesex$559,900 38.1%1-80.0%5-37.5%5
Montpelier$435,000 8.9%29-9.4%38-9.5%59
Moretown$407,500 55.2%8100.0%814.3%19
Northfield$275,000 19.6%13-13.3%21-22.2%36
Plainfield$325,000 14.3%525.0%8100.0%29
Roxbury$420,000 115.4%1-75.0%3-40.0%13
Waitsfield$457,500 -28.7%4-42.9%5-58.3%83
Warren$778,000 -13.6%7-22.2%7-46.2%28
Waterbury$465,500 16.4%1838.5%290.0%39
Woodbury$298,500 80.9%8100.0%6-14.3%60
Worcester$658,000 96.20%350.00%775.00%9

Vermont Luxury Real Estate Market

152 Wolf Lane, Lincoln, VT ~ Don’t miss this one-of-a-kind, Energy Star rated, high performance ICF Earth Sheltered custom designed home using sustainable building techniques and ecological design principles, creating maximum comfort while reducing your carbon footprint.

Single-Family January-June 2023
Median Sale Price:Average Sale Price:Units Sold:Newly Listed:Days on Market:
$1,350,000 3.9%$1,510,999 -17.4%37 0%22 -56.9%54 -6.9%

The luxury market could arguably be stated as the market segment most impacted by the pandemic.  As virtual work allowed people to move almost anywhere, many affluent buyers with both resources and flexibility chose Vermont.  The number of properties sold jumped substantially, values escalated, and sales absorbed the available inventory.  Prior to the pandemic Luxury homes had, on average, a 2–3-year supply on hand.  This quickly dropped and has remained low. 

Demand has calmed, however not diminished and sales in 2023 are flat with last year.  Buyers are still shopping, as agents report a solid number of showings for new listings. Many buyers have been willing to look outside of the traditional Burlington or lake front properties to meet their needs.  This may reflect a new balance of purchasers buying as a second home and many choosing to make these purchases their primary residents.

CountyTop townsUnits ClosedMedian Sale PriceAverage Sale PriceLowHigh
Addison3$2,600,000 $2,616,666 $1,800,000 $3,450,000
Chittenden31$1,200,000 $1,360,707 $1,000,000 $2,900,000
Burlington12$1,115,000 $1,344,083 $1,000,000 $2,900,000
Charlotte2n/a $1,800,000 $1,015,000 $1,525,000
Colchester2n/a $1,270,000 $1,500,000 $2,100,000
Essex1$1,375,000 $1,375,000 $1,375,000 $1,375,000
Richmond1$1,565,000 $1$1,565,000 $1,565,000
Shelburne8$1,178,500 $1,208,188 $1,040,000 $1,497,500
South Burlington2n/a $1,663,723 $1,425,000 $1,902,445
Underhill1$1,075,000 $1,075,000 $1,075,000 $1,075,000
Williston2n/a $1,452,500 $1,145,000 $1,760,000
Franklin-
Grand Isle3$1,725,000 $1,958,333 $1,350,000 $2,800,000
Lamoille3$1,725,000 $1,958,333 $1,350,000 $2,800,000
Washington3$1,725,000 $1,958,333 $1,350,000 $2,800,000

Vermont Multi-Family Market Results

Single-Family January-June 2023
Median Sale Price:Units Sold:Newly Listed:Days on Market:
$507,500 2.6%50 -52.8%76 -48.5%48 -2.0%

The multi-family market continues to provide owners with solid and predictable investment opportunities.  In Northwest Vermont, the median price grew a modest 2.6% while posting a 45% gain since 2020.  Despite the increase in mortgage interest rates over the past year, demand remains strong for Burlington and Chittenden County properties. In Chittenden County, where 70% of the multi- family sales closed, the median price jumped 10% over the same time last year. 

These properties are a desirable property class in large part due to low vacancy rates, rising rents, steady appreciation, tax benefits, and a hedge against stock market fluctuations. Owners may be holding onto properties as they perceive a lack of alternative investment options and don’t want to give up their pre-2022, low mortgage rates. The 53% decline in sales is a direct correlation to lack of inventory versus demand. Well-located and well-maintained properties, as usual, continue to draw the most interest, selling quickly, in many cases at or above list price.

MEDIAN SALE PRICEVS 2022UNITS SOLDVS 2022NEWLY LISTEDVS 2022DAYS ON MARKETVS 2022
Chittenden County$575,00010.1%35-57.3%52-51.9%35-12.5%
Addison County$286,000-32.7%740.0%8-46.7%11379.4%
Franklin County$287,500-3.2%8-55.6%15-16.7%47-44.1%