| Single-Family January-December 2023 | ||||
|---|---|---|---|---|
| Median Sale Price: | Average Sale Price: | Units Sold: | Newly Listed: | Days on Market: |
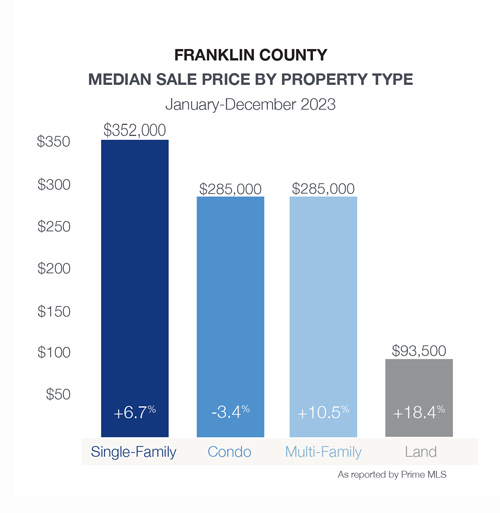
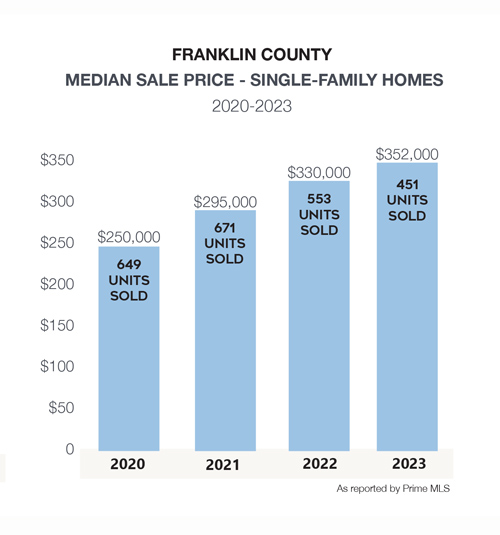
| $352,000 +6.7% | $366,898 +7.1% | 451 -18.4% | 542 -12.3% | 36 +16.1% |
| Condos January-December 2023 | ||||
|---|---|---|---|---|
| Median Sale Price: | Average Sale Price: | Units Sold: | Newly Listed: | Days on Market: |
| $285,000 -3.4% | $300,935 -3.5% | 37 -17.8% | 56 +40.0% | 12 -67.6% |
With a median sale price of $352,000, Franklin County remains the most affordable county in this report. Not only is it easily accessible to I-89, but Franklin County offers a variety of property types such as single-family, condos, multi-family, and land for buyers to consider. The robust downtown in St. Albans compliments the quintessential Vermont lifestyle offered across the rest of county.
In addition to St. Albans posting the highest number of sales – Fairfax, Georgia, and Swanton posted the largest number of sales coupled with strong increases in median sale prices indicating that these towns remain attractive to buyers.


| MEDIAN SALE PRICE | VS 2022 | UNITS SOLD | VS 2022 | NEWLY LISTED | VS 2022 | DAYS ON MARKET | |
|---|---|---|---|---|---|---|---|
| Bakersfield | $357,500 | 19.20% | 6 | -60.00% | 10 | -9.10% | 34 |
| Berkshire | $287,750 | -3.10% | 12 | -14.30% | 13 | -13.30% | 83 |
| Enosburg | $260,000 | -6.10% | 23 | -28.10% | 34 | -12.80% | 64 |
| Fairfax | $477,500 | 17.90% | 55 | 0.00% | 52 | -22.40% | 26 |
| Fairfield | $262,000 | -30.60% | 11 | 37.50% | 17 | 70.00% | 32 |
| Fletcher | $405,000 | -4.70% | 9 | 0.00% | 11 | 37.50% | 11 |
| Franklin | $265,000 | -20.30% | 11 | -38.90% | 16 | -38.50% | 94 |
| Georgia | $439,500 | 11.30% | 41 | -30.50% | 42 | -33.30% | 24 |
| Highgate | $317,500 | 5.10% | 28 | -30.00% | 30 | -31.80% | 79 |
| Montgomery | $345,000 | 13.10% | 19 | -24.00% | 27 | 8.00% | 30 |
| Richford | $210,000 | -11.40% | 29 | 20.80% | 40 | 0.00% | 63 |
| Sheldon | $340,000 | 12.60% | 15 | -11.80% | 18 | -10.00% | 18 |
| St. Albans | $340,000 | 0.00% | 119 | -20.70% | 140 | -7.90% | 20 |
| Swanton | $330,000 | 10.00% | 73 | -16.10% | 92 | -6.10% | 36 |
