Our mid-year report includes data for the first 6 months of 2020, as well as data for the 2nd quarter of 2020 alone. We cannot analyze the trends in the northwest Vermont real estate market without understanding the effects of COVID-19 which struck Vermont in mid-March.
| Single Family January-June | ||||
|---|---|---|---|---|
| Median Sale Price: | Average Sale Price: | Units Sold: | Newly Listed: | Days on Market: |
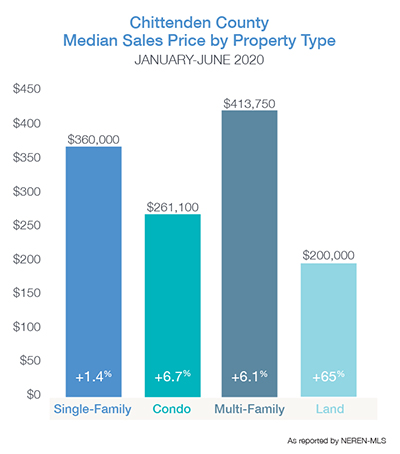
| $360,000 +1.4% | $420,483 +2.8% | 467 -18.8% | 715 -22.1% | 56 0% |
| Condo January-June | ||||
|---|---|---|---|---|
| Median Sale Price: | Average Sale Price: | Units Sold: | Newly Listed: | Days on Market: |
| $261,100 +6.6% | $286,077 +4.0% | 272 -9.6% | 353 -1.9% | 55 -27.6% |
| Single Family April-June | ||||
|---|---|---|---|---|
| Median Sale Price: | Average Sale Price: | Units Sold: | Newly Listed: | Days on Market: |
| $376,000 +3.0% | $427,373 +2.2% | 257 -32% | 437 -26.1% | 42 -20.8% |
| Condo April-June | ||||
|---|---|---|---|---|
| Median Sale Price: | Average Sale Price: | Units Sold: | Newly Listed: | Days on Market: |
| $249,000 +0.6% | $276,673 +0.5% | 153 -30.1% | 217 -19% | 49 -38.8% |
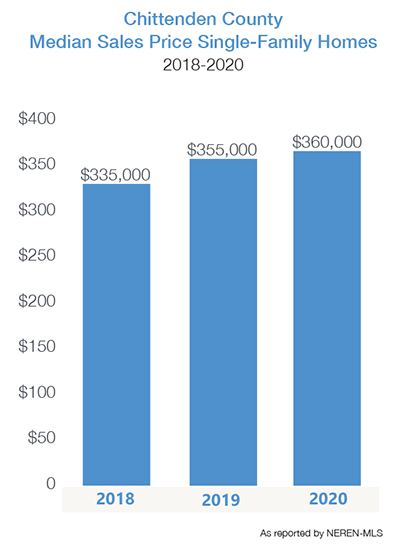
The median sale price for single-family homes continued the year over year climb to $360,000; a 7.5% increase over the same period in 2018. Condominium pricing also rose while still providing a more affordable and low maintenance option for home buyers. Newly listed homes dropped 26% during the second quarter amidst the spread of COVID-19 – increasing the pressure on an already undersupplied market. Sellers, hesitant to open their homes to in-person showings yet motivated to keep their home listed for sale, worked with our marketing team to create video tours of their property.
 Buyers acted quickly when the right property caught their eye resulting in only 42 days on the market (DOM) – the number of days from list to contract; the lowest we’ve seen in many years. In some key price points and locations, the “DOM” is in the single digits.
| MEDIAN SALE PRICE | VS 2019 | UNITS SOLD | VS 2019 | NEWLY LISTED | VS 2019 | DAYS ON MARKET | |
|---|---|---|---|---|---|---|---|
| Chittenden County Single-Family | $360,000 | 1.40% | 467 | -18.80% | 715 | -22.10% | 56 |
| Bolton | $282,500 | 12.80% | 2 | 0.00% | 6 | 20% | 42 |
| Buels Gore | n/a | n/a | n/a | n/a | n/a | n/a | n/a |
| Burlington | $347,000 | -8.20% | 65 | -30.10% | 93 | -32.10% | 44 |
| Charlotte | $522,000 | 11.10% | 21 | -22.20% | 40 | -29.80% | 104 |
| Colchester | $363,500 | 2.80% | 67 | -1.50% | 89 | -26.50% | 50 |
| Essex | $339,950 | 3.30% | 70 | -21.40% | 102 | -20.30% | 40 |
| Hinesburg | $349,000 | 22.30% | 12 | -40.00% | 19 | -32.10% | 64 |
| Huntington | $325,500 | -6.80% | 7 | -36.40% | 11 | -15.40% | 146 |
| Jericho | $385,000 | -4.40% | 12 | -63.60% | 29 | -35.60% | 78 |
| Milton | $289,950 | 6.60% | 40 | -4.80% | 56 | -22.20% | 37 |
| Richmond | $350,000 | 15.70% | 13 | 18.20% | 18 | -21.70% | 122 |
| Shelburne | $597,500 | 21.60% | 19 | -47.20% | 36 | -28.00% | 88 |
| South Burlington | $430,000 | 6.40% | 64 | -7.30% | 105 | -6.30% | 55 |
| St. George | $434,393 | 13.70% | 9 | 350% | 10 | 25.00% | 41 |
| Underhill | $326,500 | 20.60% | 9 | 28.60% | 21 | -19.20% | 66 |
| Westford | $314,900 | 14.50% | 13 | -7.10% | 18 | 0.00% | 75 |
| Williston | $397,000 | -17.00% | 28 | -9.70% | 46 | -4.20% | 38 |
| Winooski | $266,750 | 15.50% | 16 | -20% | 16 | -40.70% | 46 |
| MEDIAN SALE PRICE | VS 2019 | UNITS SOLD | VS 2019 | NEWLY LISTED | VS 2019 | DAYS ON MARKET | |
|---|---|---|---|---|---|---|---|
| Chittenden County Condo | $261,100 | 6.70% | 272 | -9.60% | 353 | -1.90% | 55 |
| Bolton | $126,500 | -1.30% | 8 | 0.00% | 10 | 67% | 48 |
| Burlington | $317,500 | 9.10% | 39 | -2.50% | 55 | -12.70% | 35 |
| Colchester | $246,000 | 12.20% | 37 | -7.50% | 43 | 4.90% | 98 |
| Essex | $214,500 | -10.40% | 48 | -23.80% | 61 | -10.30% | 76 |
| Hinesburg | $286,500 | 5.40% | 1 | -66.70% | n/a | n/a | 163 |
| Jericho | $430,316 | 130.20% | 5 | 66.70% | 6 | -25.00% | 32 |
| Milton | $241,000 | 3.90% | 13 | 18.20% | 17 | 41.70% | 46 |
| Richmond | n/a | n/a | n/a | n/a | n/a | n/a | n/a |
| Shelburne | $475,000 | 15.30% | 13 | 18.20% | 15 | -11.80% | 66 |
| South Burlington | $249,000 | 8.30% | 77 | -9.40% | 101 | -5.60% | 44 |
| Williston | $302,450 | -7.40% | 20 | -28.60% | 28 | -3.50% | 20 |
| Winooski | $260,000 | 4.00% | 11 | 37.50% | 17 | 142.90% | 23 |