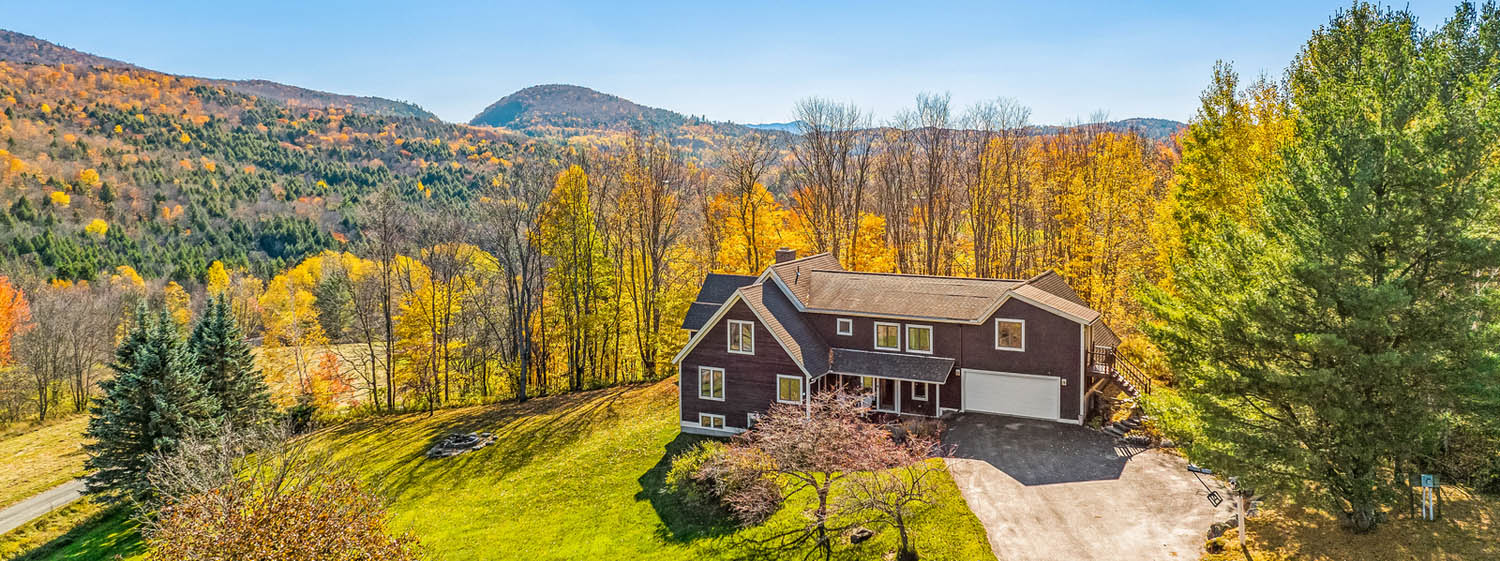
Nestled in the hills between Waterbury Reservoir and Worcester Mountain Range, this stunning home faces east for a morning glow and stunning mountain scenery. Waterbury | MLS# 4948757
| Single Family Q1 2023 | |||
|---|---|---|---|
| New Listings | Units Sold | Median Sold Price | Days on Market |
| 79 (-26%) | 62 (-45%) | $319K (+23%) | 21 (+75%) |
| Condo Q1 2023 | |||
|---|---|---|---|
| New Listings | Units Sold | Median Sold Price | Days on Market |
| 30 (-21%) | 19 (+0%) | $320K (+52%) | 10 (-44%) |
The first quarter of 2023 was challenging for the single-family home market in Washington County, with a significant decline of around 45% in sales volume compared to the same period last year. Additionally, new listings for single-family homes in the county dropped by approximately 26% year-over-year, contributing to the limited inventory and increased competition among buyers.
Despite the challenges faced by the single-family home market, the median sold price for single-family homes in Washington County increased by approximately 23% compared to the first quarter of 2022, indicating that demand remains strong in this segment of the market.
The condo market in Washington County was more stable, with flat sales volume but a significant increase of around 52% in the median sold price for condos compared to the first quarter of 2022. However, the number of new listings for condos dropped by approximately 21% year-over-year, indicating that inventory remains limited in this segment of the market as well.
| NEW LISTINGS | VS Q1 2021 | PROPERTIES SOLD | VS Q1 2021 | MEDIAN SOLD PRICE | VS Q1 2021 | MEDIA DOM | |
|---|---|---|---|---|---|---|---|
| Barre City | 12 | -37% | 9 | -65% | $220 K | 9.45% | 16 |
| Single Family | 11 | -42% | 8 | -68% | $210 K | 5.00% | 28 |
| Condo | 1 | 1 | 0.00% | $260 K | -2.44% | 5 | |
| Barre Town | 12 | -57% | 10 | -60% | $375 K | 58% | 75 |
| Single Family | 11 | -59% | 10 | -58% | $375 K | 62% | 75 |
| Condo | 1 | 0.00% | 0 | $0 | 0 | ||
| Berlin | 3 | -40% | 6 | -14% | $345 K | 23% | 20 |
| Single Family | 3 | -25% | 5 | -17% | $385 K | 38% | 36 |
| Condo | 0 | 1 | 0.00% | $305 K | 8.97% | 3 | |
| Calais | 4 | 300% | 1 | -75% | $585 K | 23% | 2 |
| Single Family | 4 | 300% | 1 | -75% | $585 K | 23% | 2 |
| Condo | 0 | 0 | $0 | 0 | |||
| Fayston | 2 | -67% | 2 | -50% | $367 K | -49% | 11 |
| Single Family | 1 | -75% | 0 | $0 | 0 | ||
| Condo | 1 | -50% | 2 | $367 K | 11 | ||
| Marshfield | 1 | -50% | 1 | -50% | $609 K | 380% | 9 |
| Single Family | 1 | -50% | 1 | -50% | $609 K | 380% | 9 |
| Condo | 0 | 0 | $0 | 0 | |||
| Middlesex | 1 | 0.00% | 1 | -50% | $560 K | 38% | 5 |
| Single Family | 1 | 0.00% | 1 | -50% | $560 K | 38% | 5 |
| Condo | 0 | 0 | $0 | 0 | |||
| Montpelier | 13 | -13% | 12 | -29% | $316 K | -13% | 100 |
| Single Family | 7 | -46% | 8 | -50% | $329 K | -12% | 116 |
| Condo | 6 | 200% | 4 | 300% | $293 K | 50% | 23 |
| Moretown | 4 | 300% | 4 | 300% | $229 K | 252% | 3 |
| Single Family | 2 | 100% | 3 | 200% | $299 K | 360% | 4 |
| Condo | 2 | 1 | $159 K | 3 | |||
| Northfield | 8 | -11% | 7 | 40% | $270 K | 10% | 15 |
| Single Family | 8 | 0.00% | 7 | 40% | $270 K | 10% | 15 |
| Condo | 0 | 0 | $0 | 0 | |||
| Plainfield | 4 | 300% | 1 | -67% | $233 K | -6.35% | 6 |
| Single Family | 4 | 300% | 1 | -67% | $233 K | -6.35% | 6 |
| Condo | 0 | 0 | $0 | 0 | |||
| Waitsfield | 4 | -33% | 5 | 25% | $405 K | 229% | 10 |
| Single Family | 2 | -33% | 3 | $450 K | 144 | ||
| Condo | 2 | -33% | 2 | -50% | $234 K | 90% | 8 |
| Warren | 19 | -39% | 9 | -31% | $570 K | 107% | 25 |
| Single Family | 3 | 0.00% | 2 | 0.00% | $1.17 M | 60% | 6 |
| Condo | 16 | -43% | 7 | -36% | $320 K | 24% | 43 |
| Waterbury | 12 | 20% | 10 | 150% | $630 K | 98% | 14 |
| Single Family | 11 | 10% | 9 | 125% | $740 K | 133% | 21 |
| Condo | 1 | 1 | $520 K | 5 | |||
| Woodbury | 3 | 3 | 50% | $240 K | 55% | 6 | |
| Single Family | 3 | 3 | 50% | $240 K | 55% | 6 | |
| Condo | 0 | 0 | $0 | 0 | |||
| Total | 109 | -25% | 81 | -38% | $320 K | 24% | 18 |
| Single Family | 79 | -26% | 62 | -45% | $319 K | 23% | 21 |
| Condo | 30 | -21% | 19 | 0.00% | $320 K | 52% | 10 |