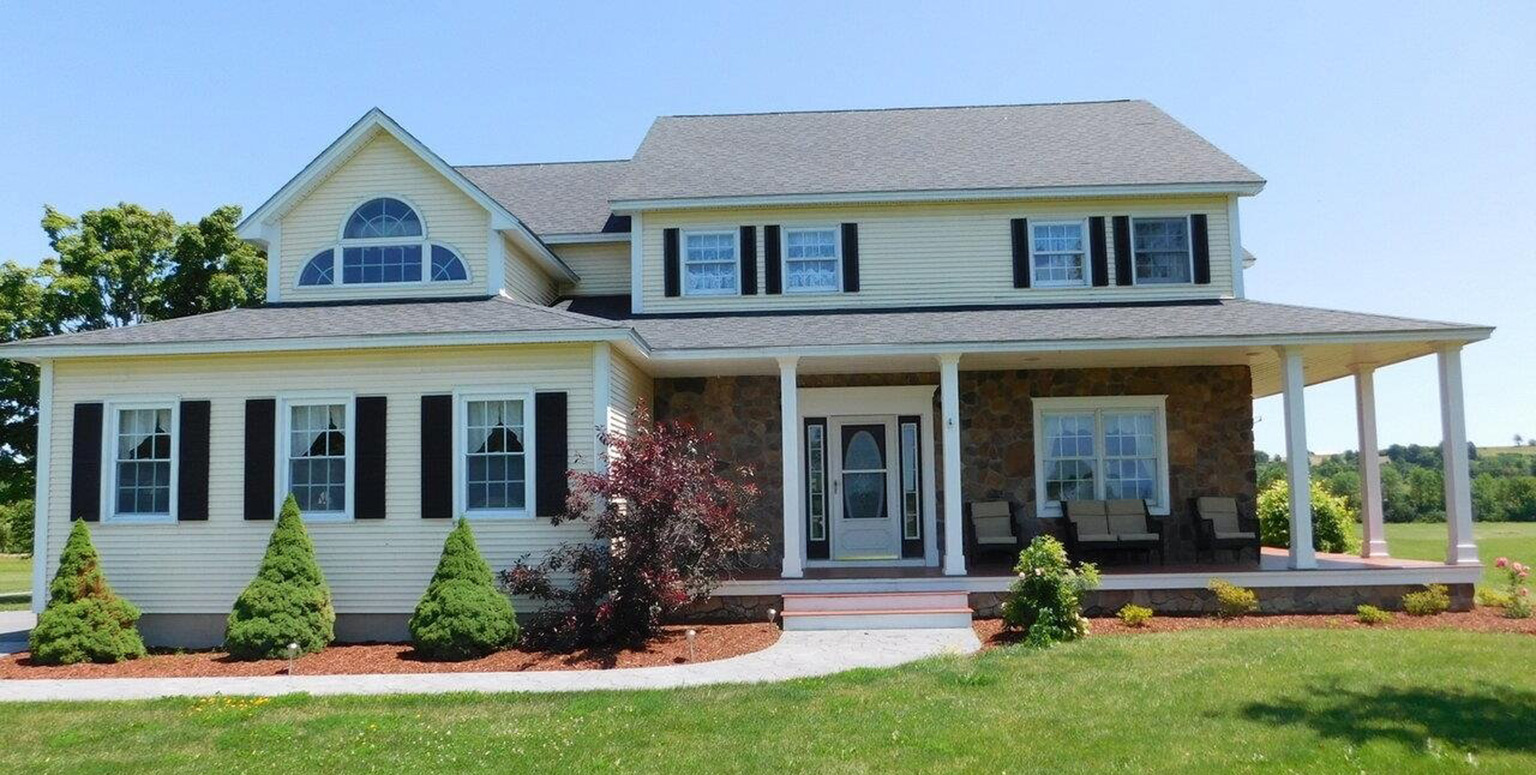
517 Greenbush Road, Charlotte, VT ~ Amazing property on 5 country acres! Over 3,700 sq. ft. on 3 levels. Large kitchen with island and shiny, black granite countertops, stainless steel appliances, and so many cabinets for storage!
Single-Family January-June 2022
Median Sale Price:
Average Sale Price:
Units Sold:
Newly Listed:
Days on Market:
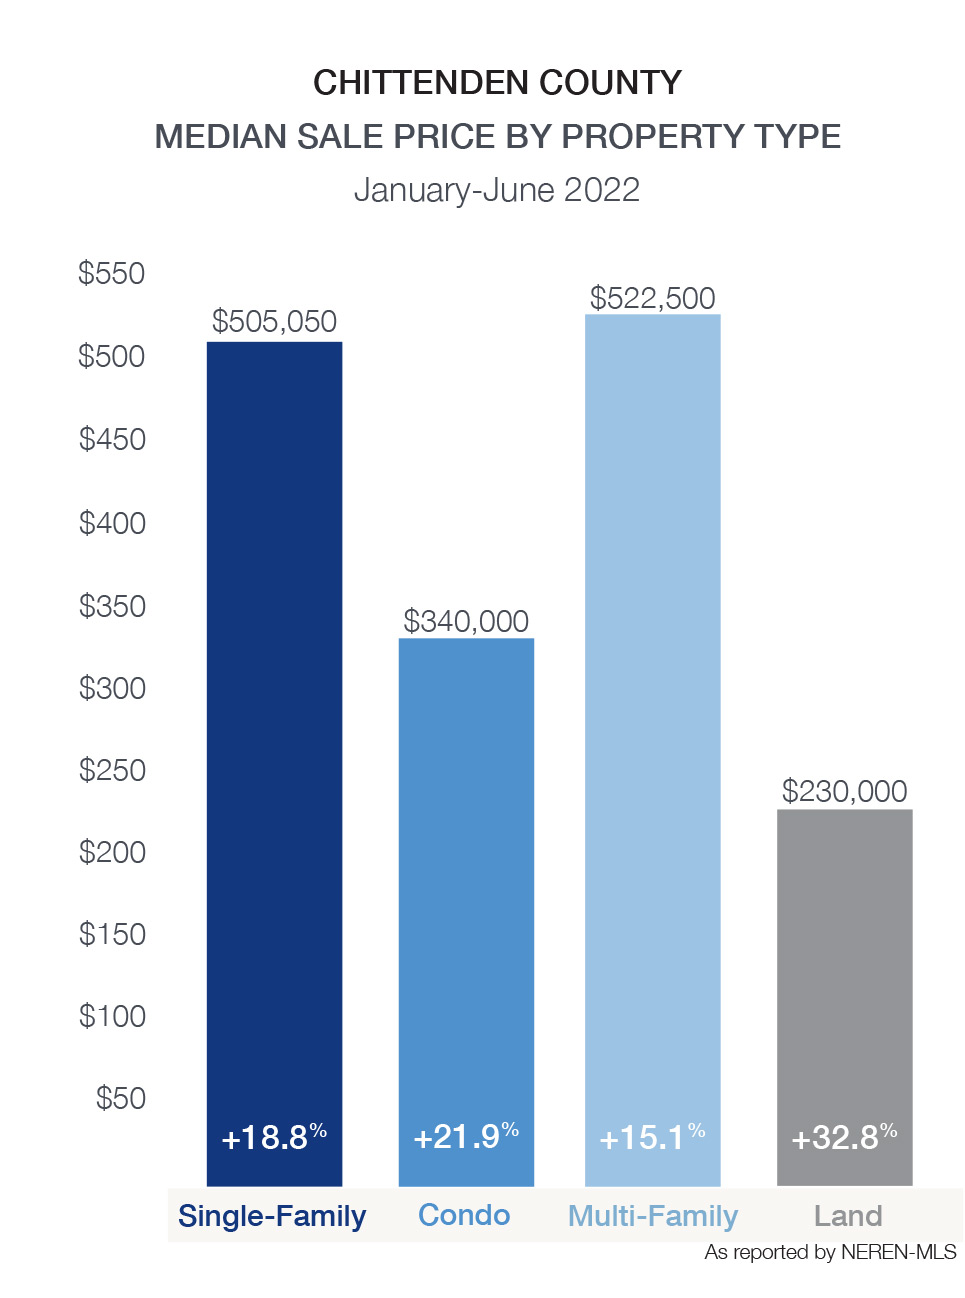
$505,050 +18.8%
$608,421 +21.4%
484 -9.7%
659 -15.4%
19 -38.7%
Condo January-June 2022
Median Sale Price:
Average Sale Price:
Units Sold:
Newly Listed:
Days on Market:
$340,000 +21.9%
$385,790 +21.7%
313 +12.2%
376 -1.3%
22 -35.3%
Both single-family homes and condos showed substantial price appreciation in Chittenden County. The median sale price of single-family homes rose to $505,050 – a record high. Newly listed properties dropped 15.4% to 559. Pending single-family homes in May, an indicator of home sales to come, were flat with last year and showed a 10.2% decline over a 12-month average. Limited choice and slowing buyer demand are two contributing factors to this decline.
While condominium options are slightly more plentiful in Chittenden County, new inventory was down 1.3% from 2021 with 376 new listings. Limited inventory continued to put pressure on prices as the median sale price of condominiums appreciated to $340,000, a nearly 22% increase over last year. Higher interest rates, coupled with inflation are slowing cooling demand. It is anticipated that inventory will gradually increase, slowing down price appreciation.