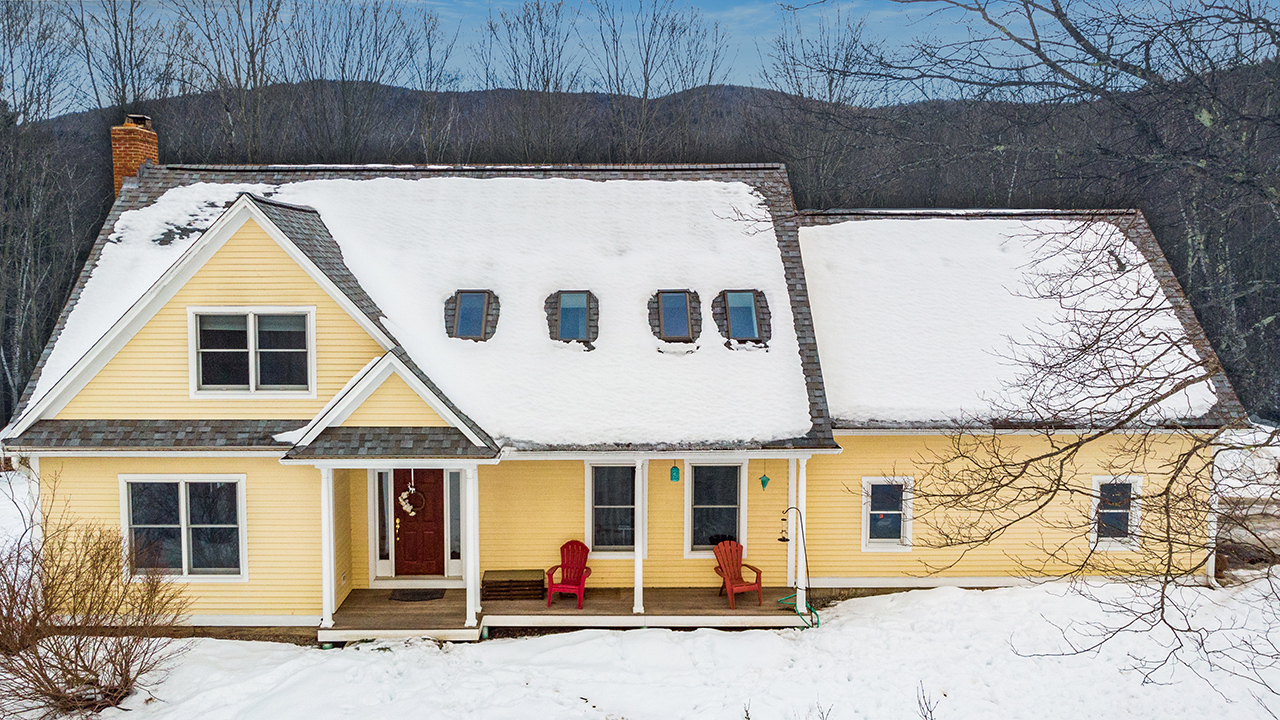
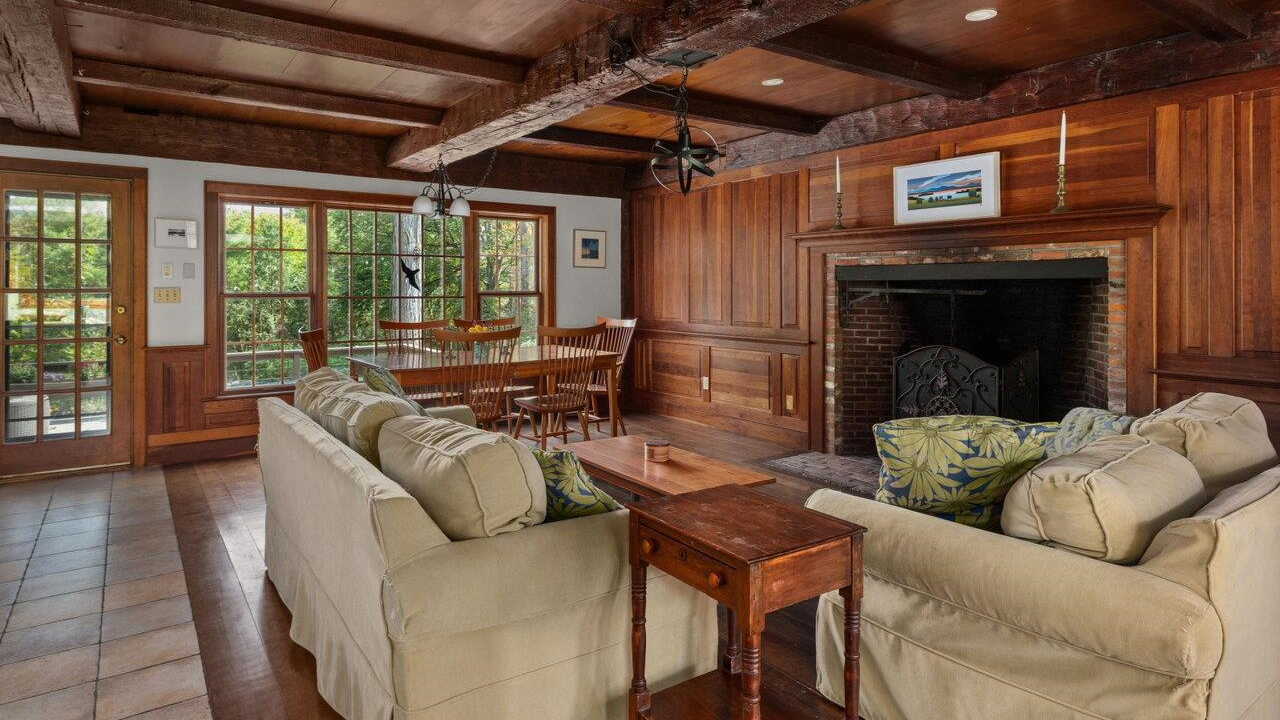
255 Upland Mowing Road, Waterbury, VT ~ Modern, quintessential Vermont style! A perfect blend of comfort & country charm in this Waterbury farmhouse.
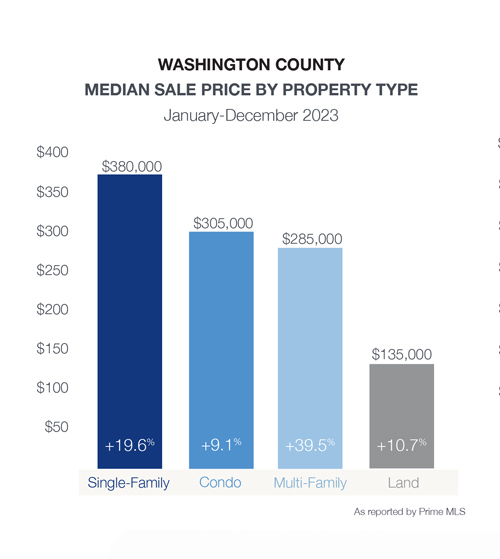
Single-Family January-December 2023
Median Sale Price:
Average Sale Price:
Units Sold:
Newly Listed:
Days on Market:
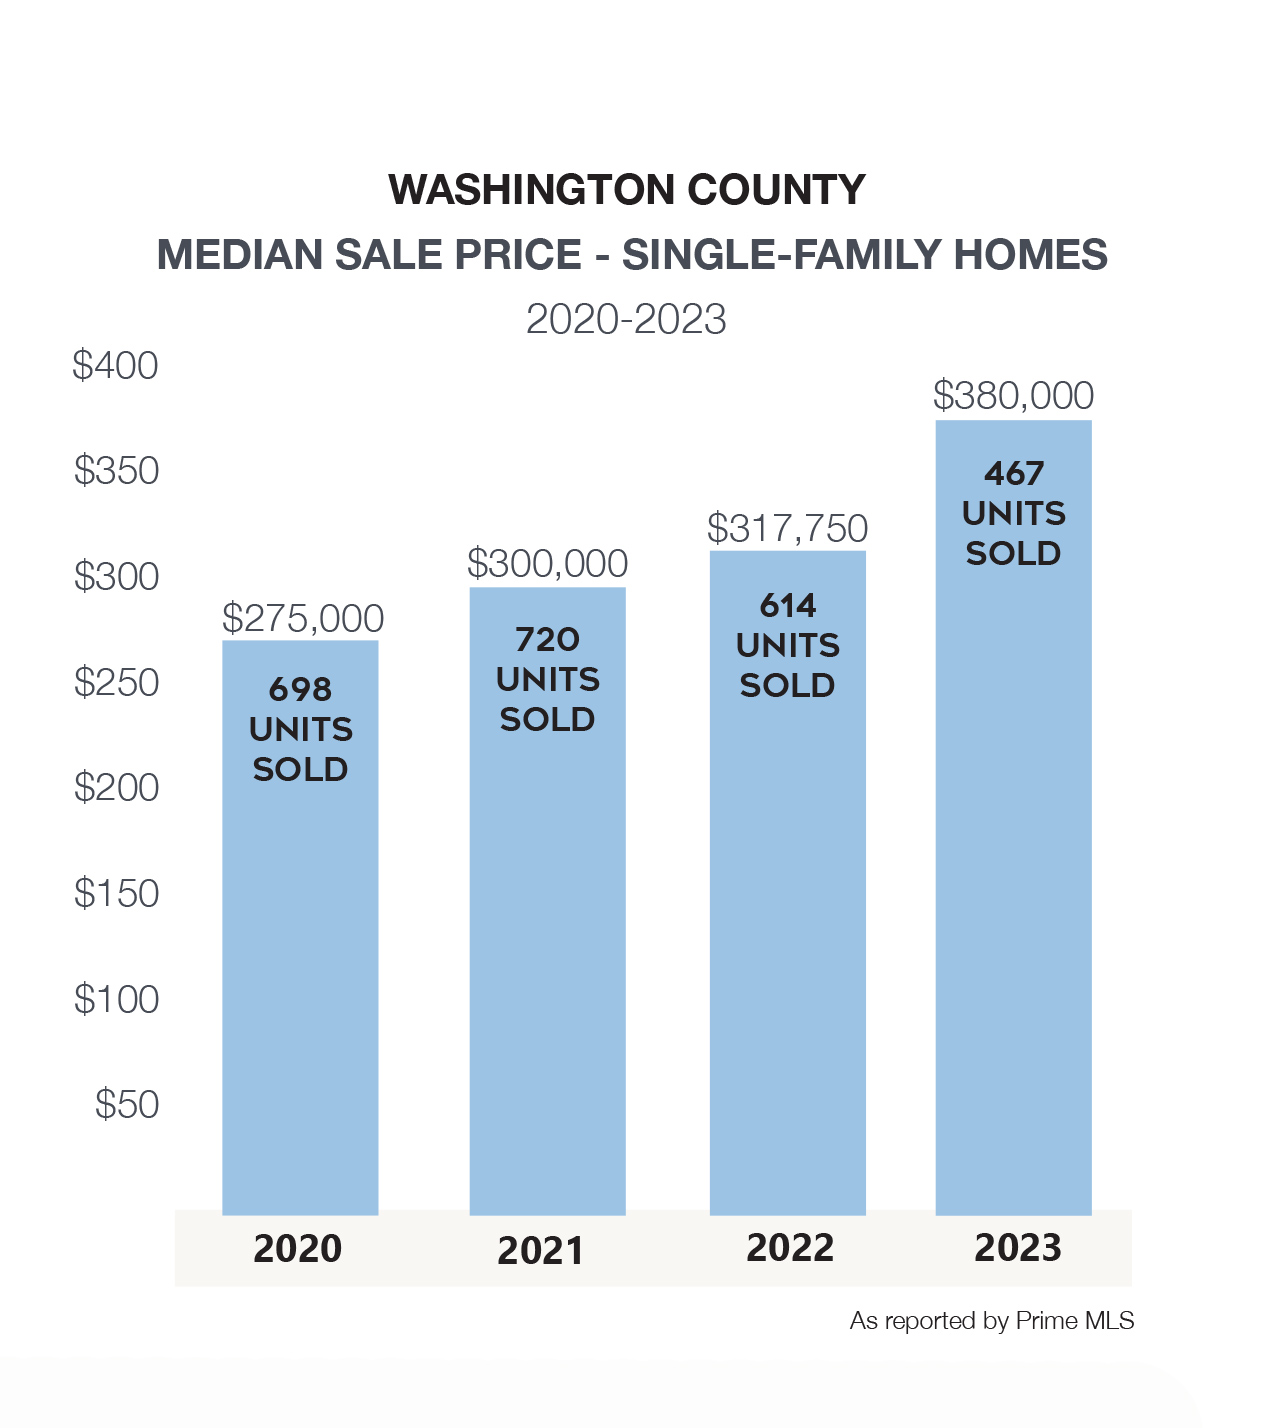
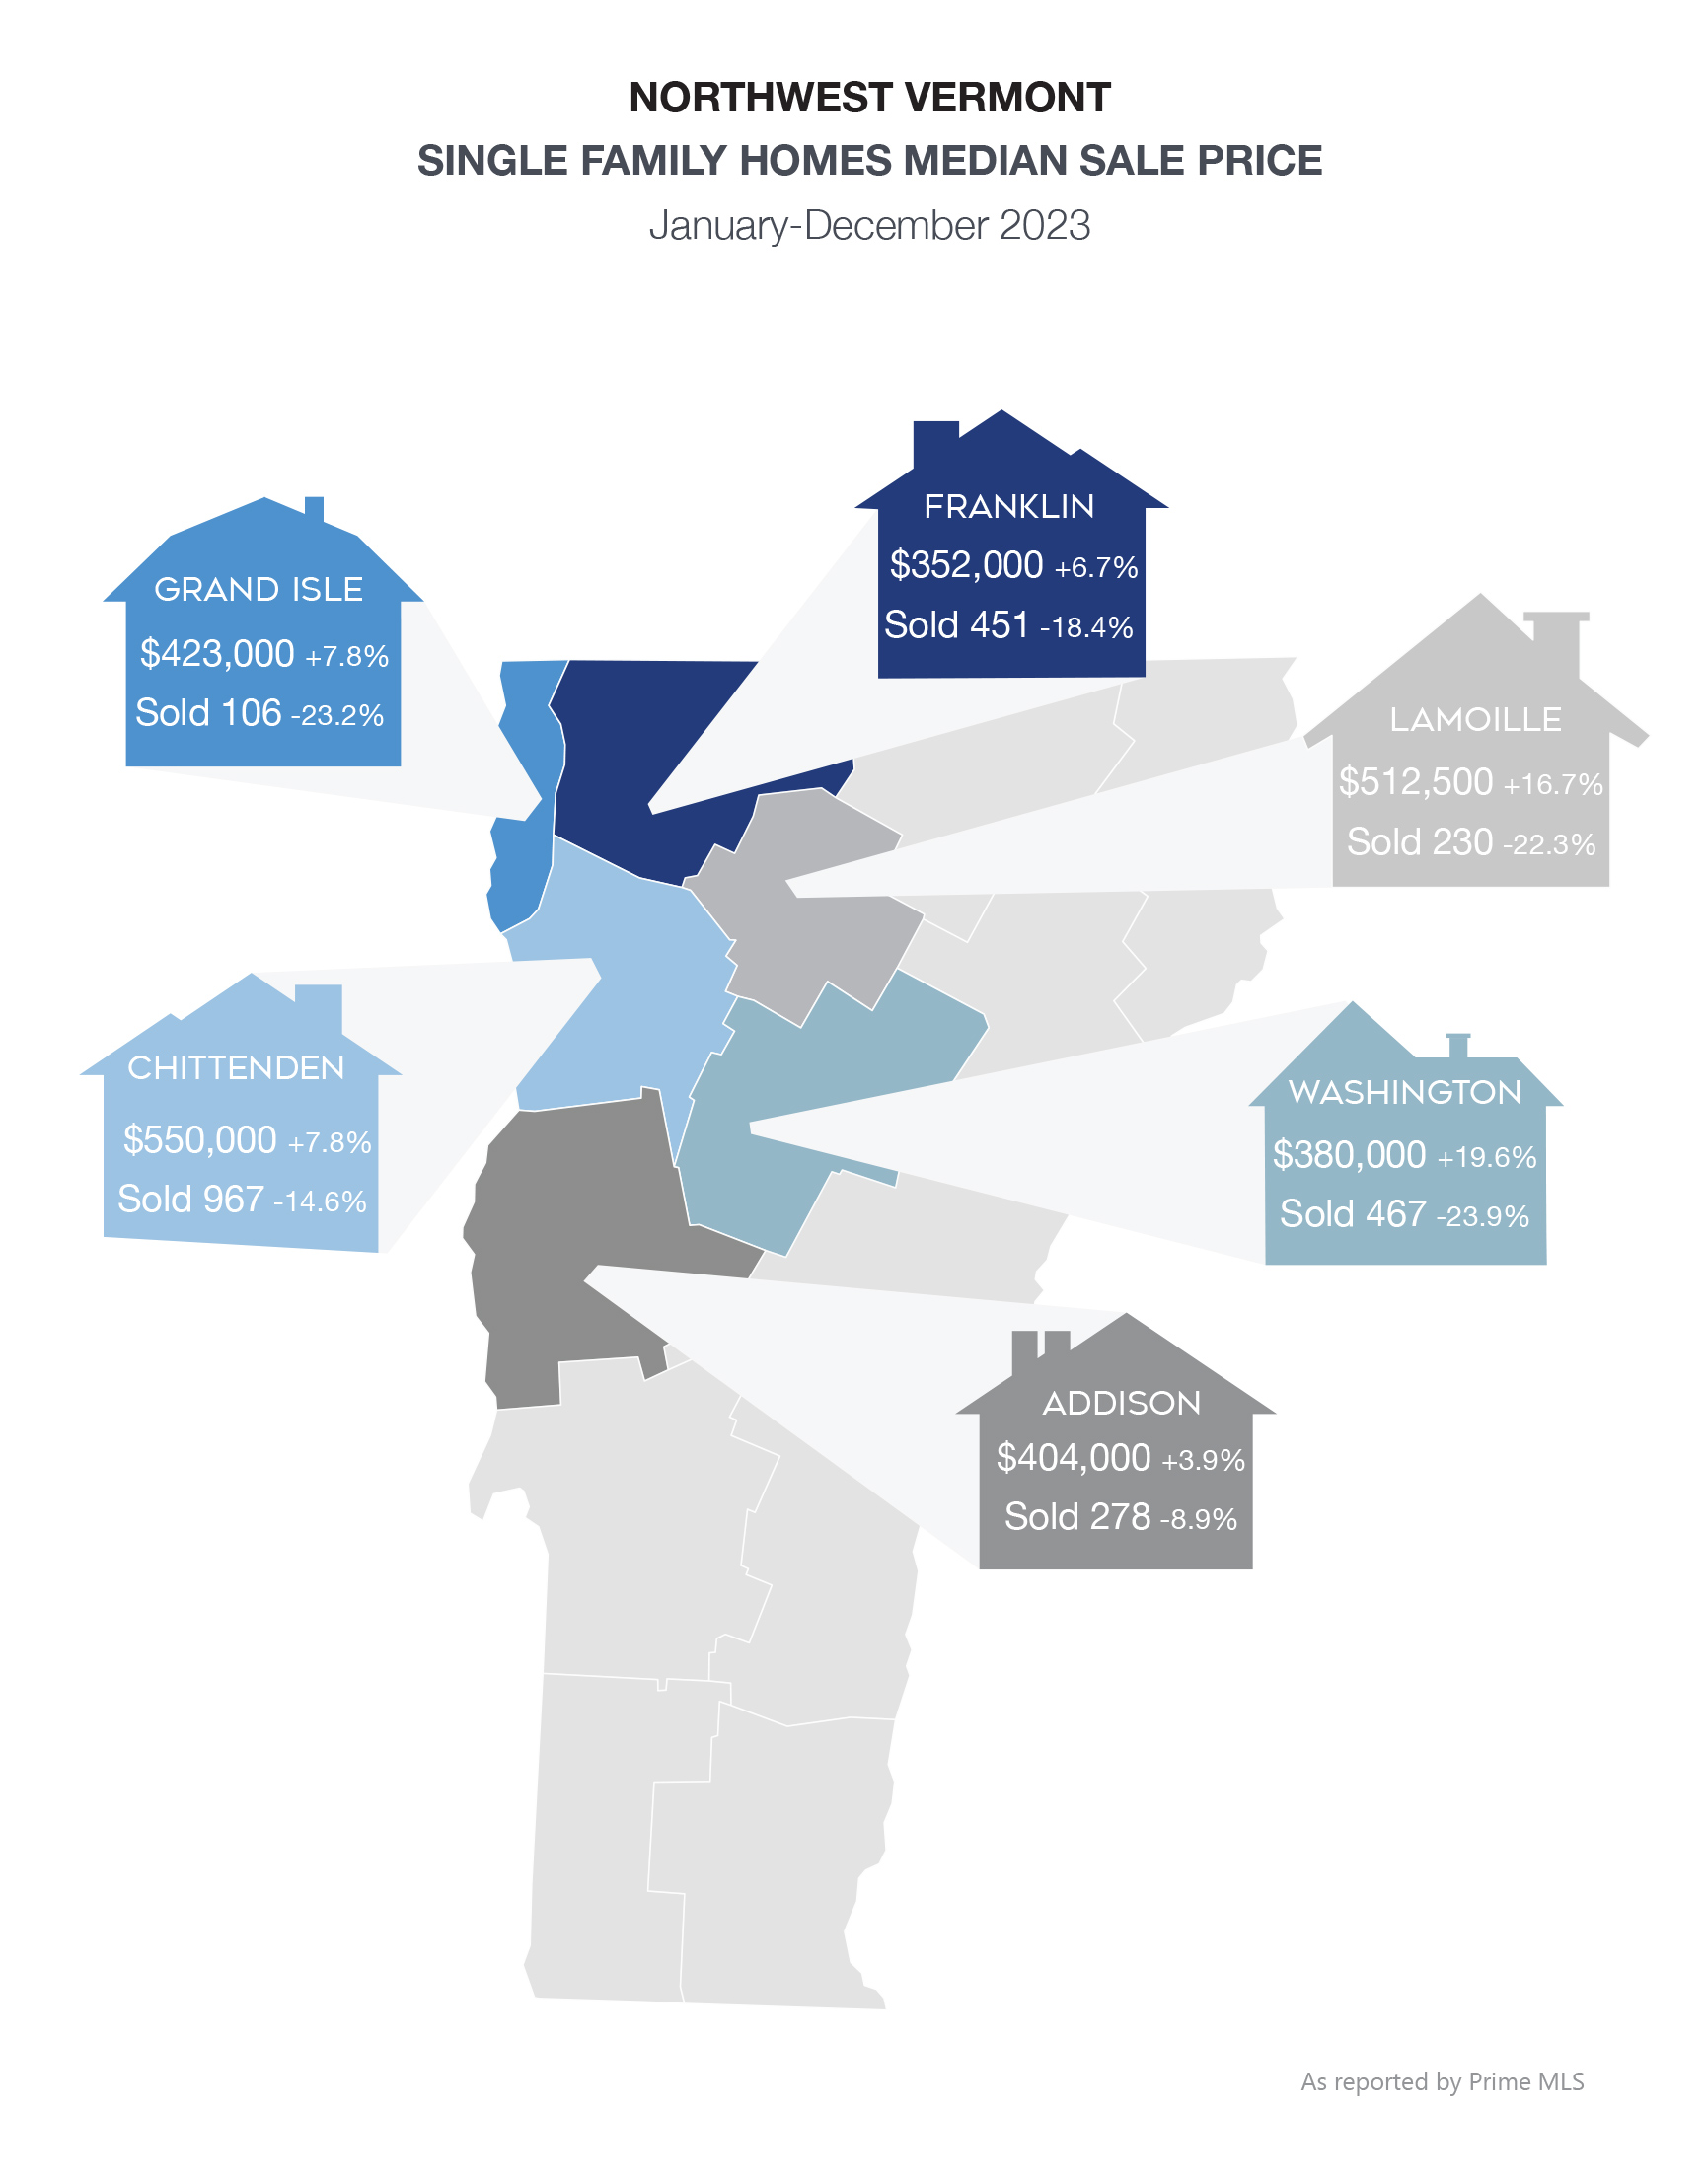
$380,000 +19.6%
$452,715 +16.8%
467 -23.9%
576 -10.1%
30 -3.2%\
Condos January-December 2023
Median Sale Price:
Average Sale Price:
Units Sold:
Newly Listed:
Days on Market:
$305,000 +9.1%
$356,522 +1.1%
98 -10.9%
114 -4.2%
24 -11.1%
Home to the state capital of Montpelier, with Barre being the most populous municipality, the Washington County real estate market is robust and varied. A drop of 10% in homes available for sale failed to meet buyer demand resulting in a 24% decline in closed sales. As a result, the median sale price jumped by nearly 20%. In July, parts of the county sustained damage due to flooding from severe storms. Homes and businesses cleaned up with some, but not all, hoping to rebuild.
Warren, Fayston, and Waterbury posted median sale prices far above the county average of $380,000 largely driven by the vacation and luxury home markets. Barre and Montpelier posted the most closed sales because of the higher population and number of primary residences.
1108 Quarry Road, Middlebury, VT ~ Tucked away with views of the Green Mountains is this 14-acre haven of unspoiled woodland beauty surrounding a large pond.
Single-Family January-December 2023
Median Sale Price:
Average Sale Price:
Units Sold:
Newly Listed:
Days on Market:
$1,300,000 0%
$1,503,209 -10.7%
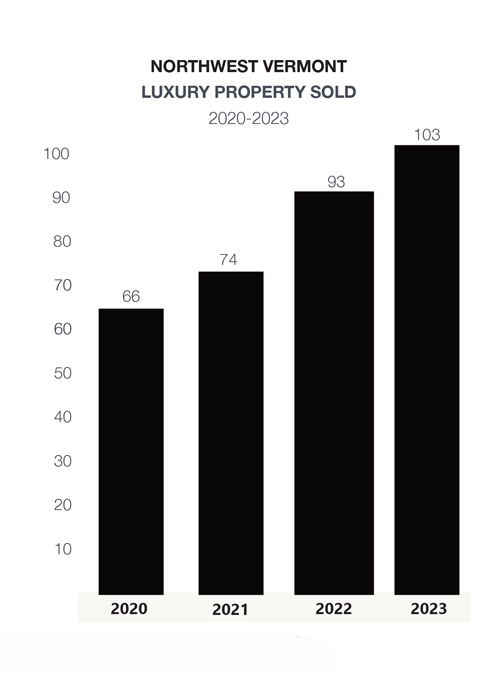
103 +13.2%
86 -4.4%
42 +5%
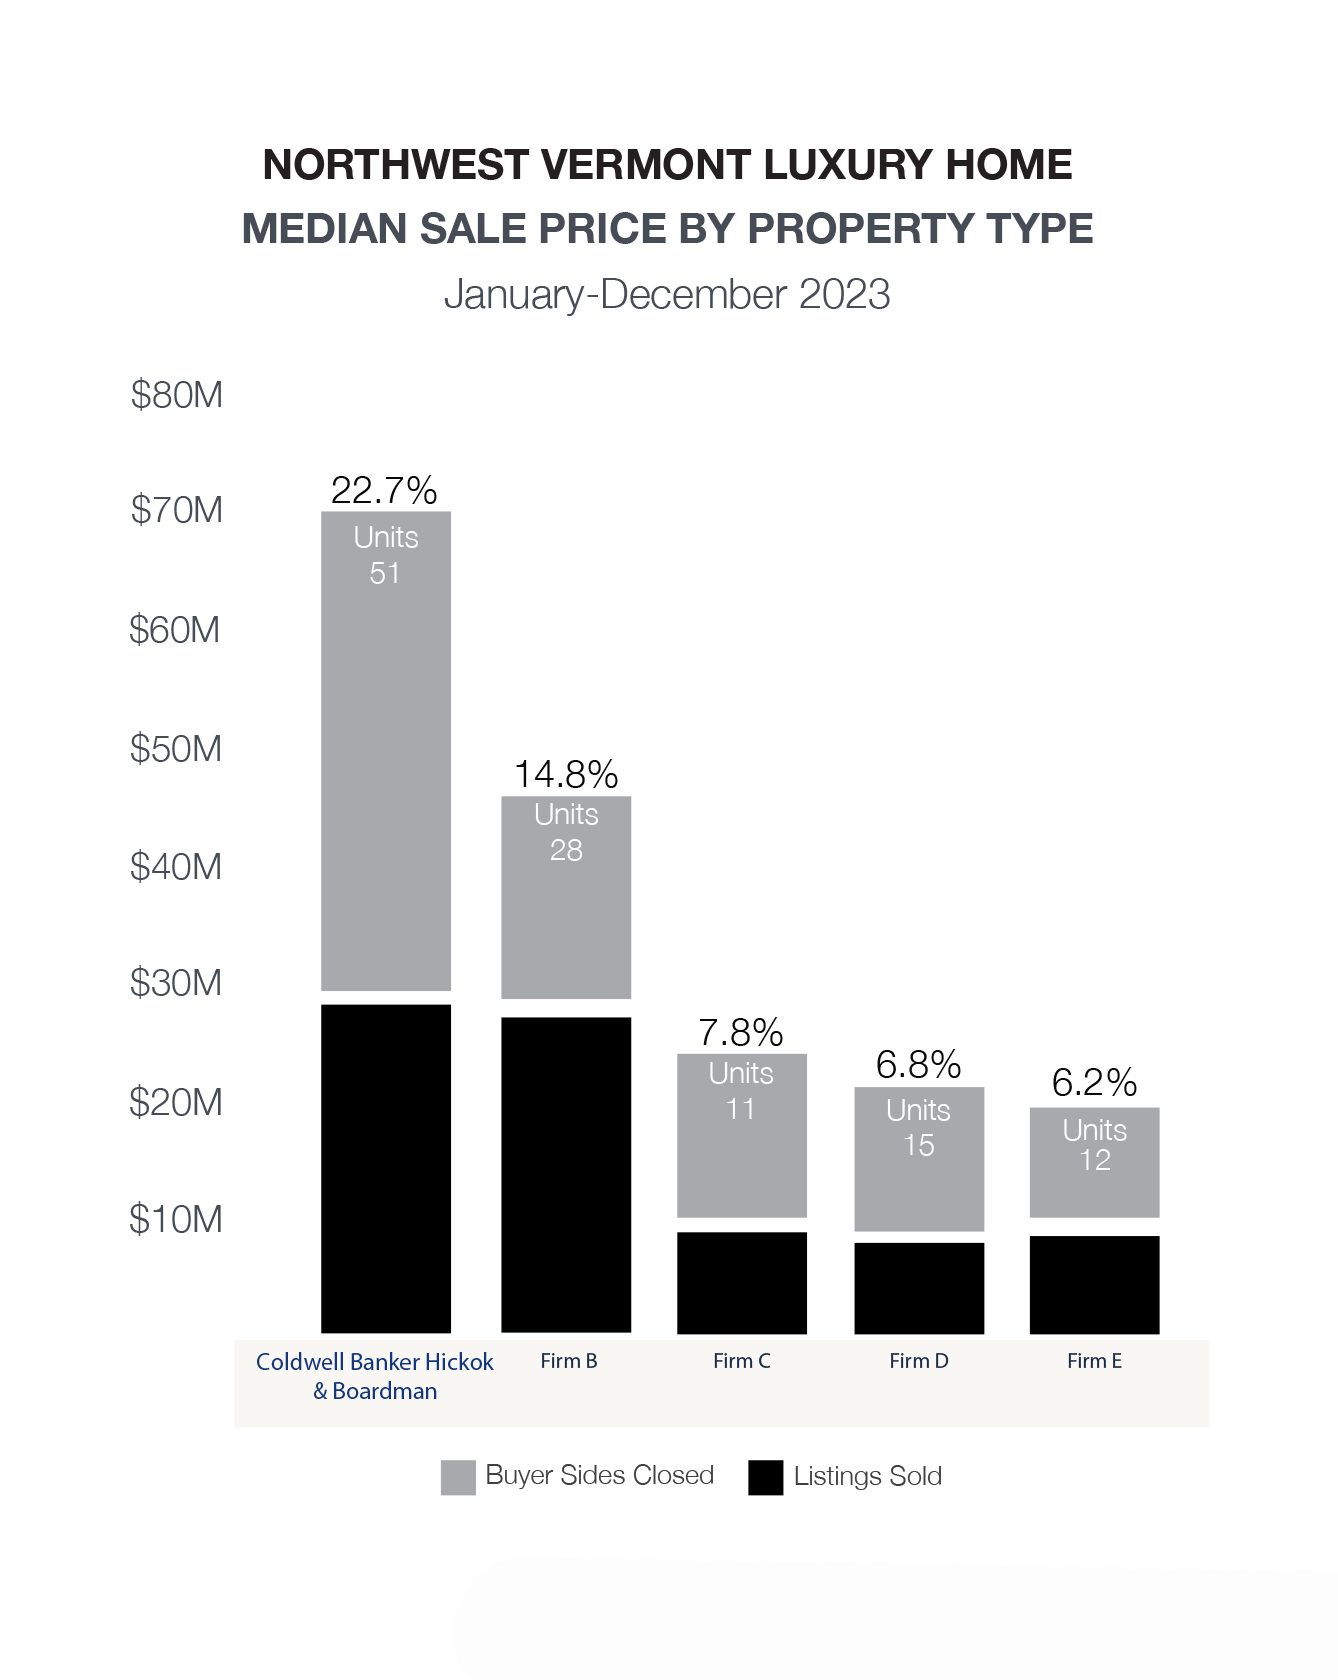
In the luxury market (defined in this report as residential properties with a sale price of $1,000,000 or more), the median sale price remained steady at $1,300,000 while the number of sales increased by 13% to 103 units. With many high-end buyers paying cash for their purchase, the rising mortgage rates had less impact on this segment of the market. Agents reported a solid number of showings for new listings as buyers looked outside of Burlington and lakefront properties to meet their needs. Locally our agents closed 1 in 4 luxury transactions in northwest Vermont – far more than any company in our area.
Our skilled agents and our 360-degree marketing approach combine to share the beauty of luxury homes with an affluent audience locally, nationally, and globally. Many of our agents are certified as Luxury Property Specialists. Aligning them with the best among Coldwell Banker agents. In 2023, Coldwell Banker affiliated agents achieved tremendous results with $267 million in Luxury closed sales daily and an average sale price of $1,900,000 worldwide.
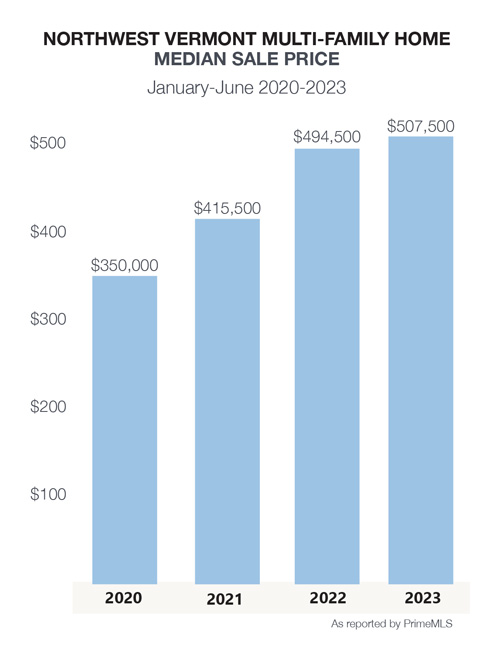
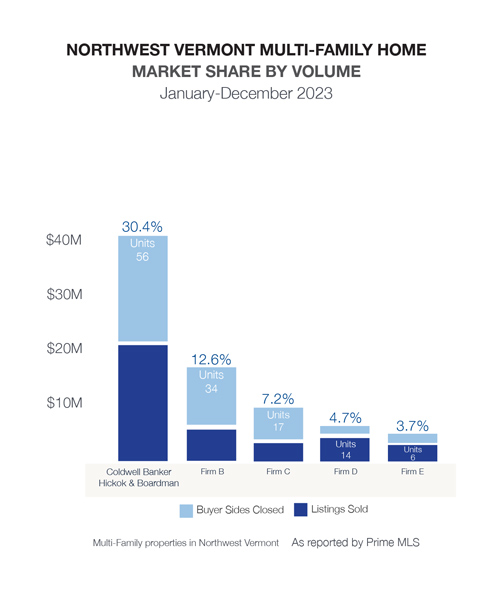
Many real estate investors paused during 2023 as reflected in a 35% decline in properties sold and the minimal change in the median sale price. While residential property sales are largely driven by “life stages or life changes”, the purchases of multi-family and investment properties are driven by analytics. Higher mortgage interest rates adversely affected the purchase opportunities in the market. The number of multi-family units coming to market dropped 10%. These properties are a desirable property class in large part due to low vacancy rates, rising rents, steady appreciation, tax benefits, and a hedge against stock market fluctuations. Owners may be holding onto properties as they perceive a lack of alternative investment options and don’t want to give up their pre-2022, low mortgage rates.
147 South Cove Road, Burlington, VT ~ An unique opportunity to have the location you need paired with the lakefront views you’ve always wanted.
Land January-December 2023
Median Sale Price:
Average Sale Price:
Units Sold:
Newly Listed:
Days on Market:
$139,000 +0.4%
$210,078 -0.2%
185 -20.9%
301 -6.8%
118 -23.4%
The number of land parcels sold in 2023 declined sharply over the prior year on top of the 27% decline in 2022. This period of decline follows amplified sales realized in 2021. However, 2023 results do not accurately reflect buyer interest as much as the same shortage in available inventory we are seeing in other segments of the real estate market. The number of days on the market for land is just over 4 months, down from 5 months in 2022 and 8 months in 2021 demonstrating that buyers were ready to make a move when the right property hit the market.
Franklin County’s median sale price jumped over 18% yet remains more affordable than other northwest Vermont counties. Washington & Addison Counties posted the most sales in the region with 99 and 60 lots closed respectively.
The 532 new units projected to open in 2023 is 53% higher than the average Chittenden County growth over the past 3 years, and 82% higher than the long-term average since 2000. Of the 532 expected units, 57% (304) are already completedThe current 2024 forecast shows 872 apartments are expected to open in 2024. This will be the highest number of units to open in a single year since the report record began in 2000. Most of these units are planned for South Burlington (420 units or 48%), followed by Burlington at 279 units or 32%. It’s important to note that almost 300 of the South Burlington units are part of UVM & UVM Health Network’s construction project to house students and faculty off campus. These units are not made available to the general public. *Source: Allen, Brooks, & Minor Report, December 2023 as of June. For comparison, the total of new units constructed in 2022 was 291, a promising indicator.
AVERAGE APARTMENT RENTS IN CHITTENDEN COUNTY
RANGE
Studio, 1 Bath
$1,300 - $2,050
One Bedroom, 1 Bath
$1,400 - $3,000
Two Bedroom, 1 Bath
$1,675 - $4,000
Two Bedroom, 2 Bath
$1,850 - $4,200
Coldwell Banker Hickok & Boardman’s Relocation Department assists individuals and companies with employment related transfers. Through that service, we understand people considering a move to Vermont may want to get to know the area before deciding to purchase a home. Renting or longterm stay options can be an alternative – but in a competitive rental market, like Chittenden County, finding a place can be a challenge.
Contact us for our Chittenden County Rental Guide to aid in your rental search. Our guide includes an update on the current rental market, information about new complexes, and answers to the most frequently asked questions. Go to HickokandBoardman.com/vermont-rental-guide for a free download.
Hillside at O’Brien Farm is a 30+ acre neighborhood of thoughtfully designed, energy efficient homes in the heart of South Burlington. HillsideVT.com
Looking back at 2023, it is evident that the year was characterized by dwindling inventory and escalating mortgage interest rates, leading to decreased affordability amid a continuing uptrend in median sale prices both regionally and nationally. Notably, the inventory of available homes in 2023 was half compared to 2019 levels, with cash transactions accounting for 30% of total transactions, up from 20% pre-pandemic. Economists, contemplating the outlook for 2024, foresee a probable adjustment in interest rates by year’s end. The question is: Will these adjustments suffice in prompting more activity among sellers and buyers, motivating them to transition from inertia to action in pursuit of significant lifestyle changes or long-postponed decisions? Residential real estate sales are largely influenced by life events such as marriages, divorces, births, deaths, or relocations.
Single-Family January-December 2023
Median Sale Price:
Average Sale Price:
Units Sold:
Newly Listed:
Days on Market:
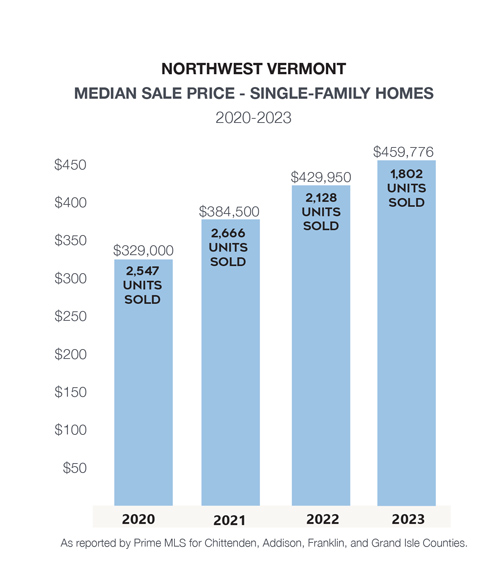
$459,776 +6.9%
$530,366 +5.8%
1,802 -15.3%
2116 -10.8%
29 +16.0%
Condos January-December 2023
Median Sale Price:
Average Sale Price:
Units Sold:
Newly Listed:
Days on Market:
$359,900 +5.9%
$404,973 +5.2%
557 -21.2%
647 -7.7%
22 +4.8%
Multi-Family January-December 2023
Median Sale Price:
Average Sale Price:
Units Sold:
Newly Listed:
Days on Market:
$572,934 + 12.2%
$484,852 -1.1%
118 -35.5%
184 -10.2%
49 -9.3%
Land January-December 2023
Median Sale Price:
Average Sale Price:
Units Sold:
Newly Listed:
Days on Market:
$139,000 +0.4%
$210,078 -0.2%
185 -20.9%
301 -6.8%
118 -23.4%
Nationally, existing home sales dropped by 18%, hitting the lowest point since 1995. On the other hand, new home sales saw a slight increase of 4.5% across the country. In Vermont, the demand for new homes far exceeds the supply, with estimates suggesting a need for approximately 6000 new homes annually, compared to the current production which falls significantly short of this figure. Challenges such as higher interest rates, labor shortages, and the complexities of the permit process hinder builders’ efforts. Notably, the top priorities for this year’s legislature revolve around safety, security, and housing. Vermont’s slow labor market growth is largely attributed to the housing shortage and affordability issues, as potential workers face difficulties relocating due to inadequate housing options.
In northwest Vermont, including counties like Chittenden, Addison, Franklin, and Grand Isle, the median sale price of single-family homes rose by nearly 7%, while the number of units sold dropped by 15%. The imbalance between supply and demand was further exacerbated by an 11% decrease in homes entering the market, pushing the median sale price to $459,776 in the area with significant variations at the city, town, and county levels. Over the past four years, median home prices have seen a 40% increase, and moderate increases are expected to continue over the next three to five years. This underscores the importance for prospective buyers to act rather than wait for price corrections or mortgage rate declines. Given the significant appreciation in home values, homeowners are advised to consider capital gains implications when deciding whether to stay put or capitalize on their equity. However, the current capital gains exemption, unchanged for 25 years, is increasingly viewed as outdated, prompting calls for adjustments to reflect inflationary trends.
Forecasts from Lawrence Yun, the Chief Economist for National Association of Realtors, suggest a potential 14% increase in home sales this year, accompanied by modest price appreciation estimates ranging between 2.5% to 5%. Despite some buyers anticipating price declines, local market conditions driven by supply-demand imbalances do not support such expectations. Various economists and institutions, including the Mortgage Bankers Association and Fannie Mae, predict mortgage rates hovering around 6% to 6.5%, a level deemed acceptable by both buyers and sellers, capable of stimulating market activity. Additionally, external factors such as the presidential election year, Federal Reserve rate adjustments, and global geopolitical developments could exert further influence on the real estate landscape in 2024.
A downward trajectory in the marketplace could incentivize homeowners with exceptionally low rates to consider selling, thereby alleviating the inventory crunch experienced in 2023. Dubbed the “lockdown effect,” many sellers have hesitated to trade their current interest rates for higher terms, but as rates gradually recede and life circumstances evolve, this grip will loosen and market activity is expected to rebound. We will continue to monitor mortgage rates throughout 2024.
In summary, amidst the complex interplay of economic indicators and socio-political factors, consumer sentiment is on the upswing, with prospective buyers encouraged to seize opportunities that align with their present and foreseeable needs while remaining within their financial means.
Long term, the solution must include more and larger development to meet demand. Reputable and well-established builders are working hard to roll out new projects and additional phases of established communities. Extensive permitting and labor shortages are impacting cost, ultimately absorbed by purchasers. More action by state and local officials is needed to satisfy demand, address affordability, and positively impact our aging housing stock.
To best navigate this market successfully, it is crucial for both buyers and sellers to be well-informed about the current conditions and trends and adapt their strategies accordingly. Our well-skilled and experienced Agents can provide you with the guidance you need to make your next move.
As expected, Spring brought about an increase in activity. Purchases and pre-approvals make up 78% of the mortgage applications at New England Federal Credit Union (NEFCU). Home equity loans have seen significant growth in the past year as homeowners capitalize on their equity position, while protecting their low first mortgage interest rate.
According to Freddie Mac, the 30-year fixed rate end the second quarter at 6.71%. In this purchase market, borrowers are growing accustomed to the higher rates. Loan Officers are hard at work issuing and updating pre-approval letters, as borrowers need to act quickly in this competitive market. Amidst the increased rate environment, we saw a 15% increase in the average loan amount in 2022, as compared to an average annual increase of 4% when considering data from the past 30 years.
NEFCU’s portfolio has seen a significant increase in Construction lending. Historically, Construction loans make up 1-2% of overall production and are currently over 5%. There has also been an increase in what the industry considers non-conventional housing. This includes off-grid properties, yurts, and tiny homes. For lenders, this can introduce complications due to conventional loan requirements. In Vermont, local lenders such as NEFCU are creating portfolio products to meet the unique housing needs of our state.
Affordable housing is a focus at the state and national level. Nationally, this comes from the Duty to Serve initiative. This is a requirement for Fannie Mae and Freddie Mac to facilitate a secondary mortgage market on housing for low, to moderate-income families. Within the Duty to Serve, we are seeing a focus shift to historically underserved markets: manufactured homes, affordable housing preservation, and rural housing.
At the state level, the Vermont Mortgage Bankers Association joined other associations like the Vermont Association of Realtors to share the story of the housing crisis as legislators worked on S100, the Omnibus Housing Bill. In addition to zoning reform, the bill gives continued to support to agencies like the Vermont Housing Finance Agency, which works with participating lenders statewide to administer loan programs and grants to support homeownership. NEFCU has seen a significant increase in borrowers benefitting from these programs; VHFA loans increased 5-fold thus far in 2023 compared to 2022. NEFCU further supports affordable housing with a portfolio down payment assistance program as well as partnerships with Community Lending Trusts throughout the state.
As we move through the rest of 2023, the focus will remain on Duty to Serve, housing affordability and how to help the most borrowers achieve homeownership.
NEFCU Disclaimer: The information in this report is for informational purposes only and does not represent an offer or commitment to provide any product or service. Any rate quotes, prices or the physical information included have been obtained from sources believed to be reliable, but we do not guarantee their accuracy or completeness. Any mentions of third-party names, products, and services are for referential purposes only and are not meant to imply any sponsorship, endorsement, or affiliation unless otherwise noted. This information is based on current market conditions and is subject to change without notice
Hillside is a neighborhood in South Burlington, Vermont, now offering 100% carbon-free, climate resilient new construction homes in Hillside East, with all the conveniences of an established community. Go To HillsideVT.com
Single-Family January-June 2023
Median Sale Price:
Average Sale Price:
Units Sold:
Newly Listed:
Days on Market:
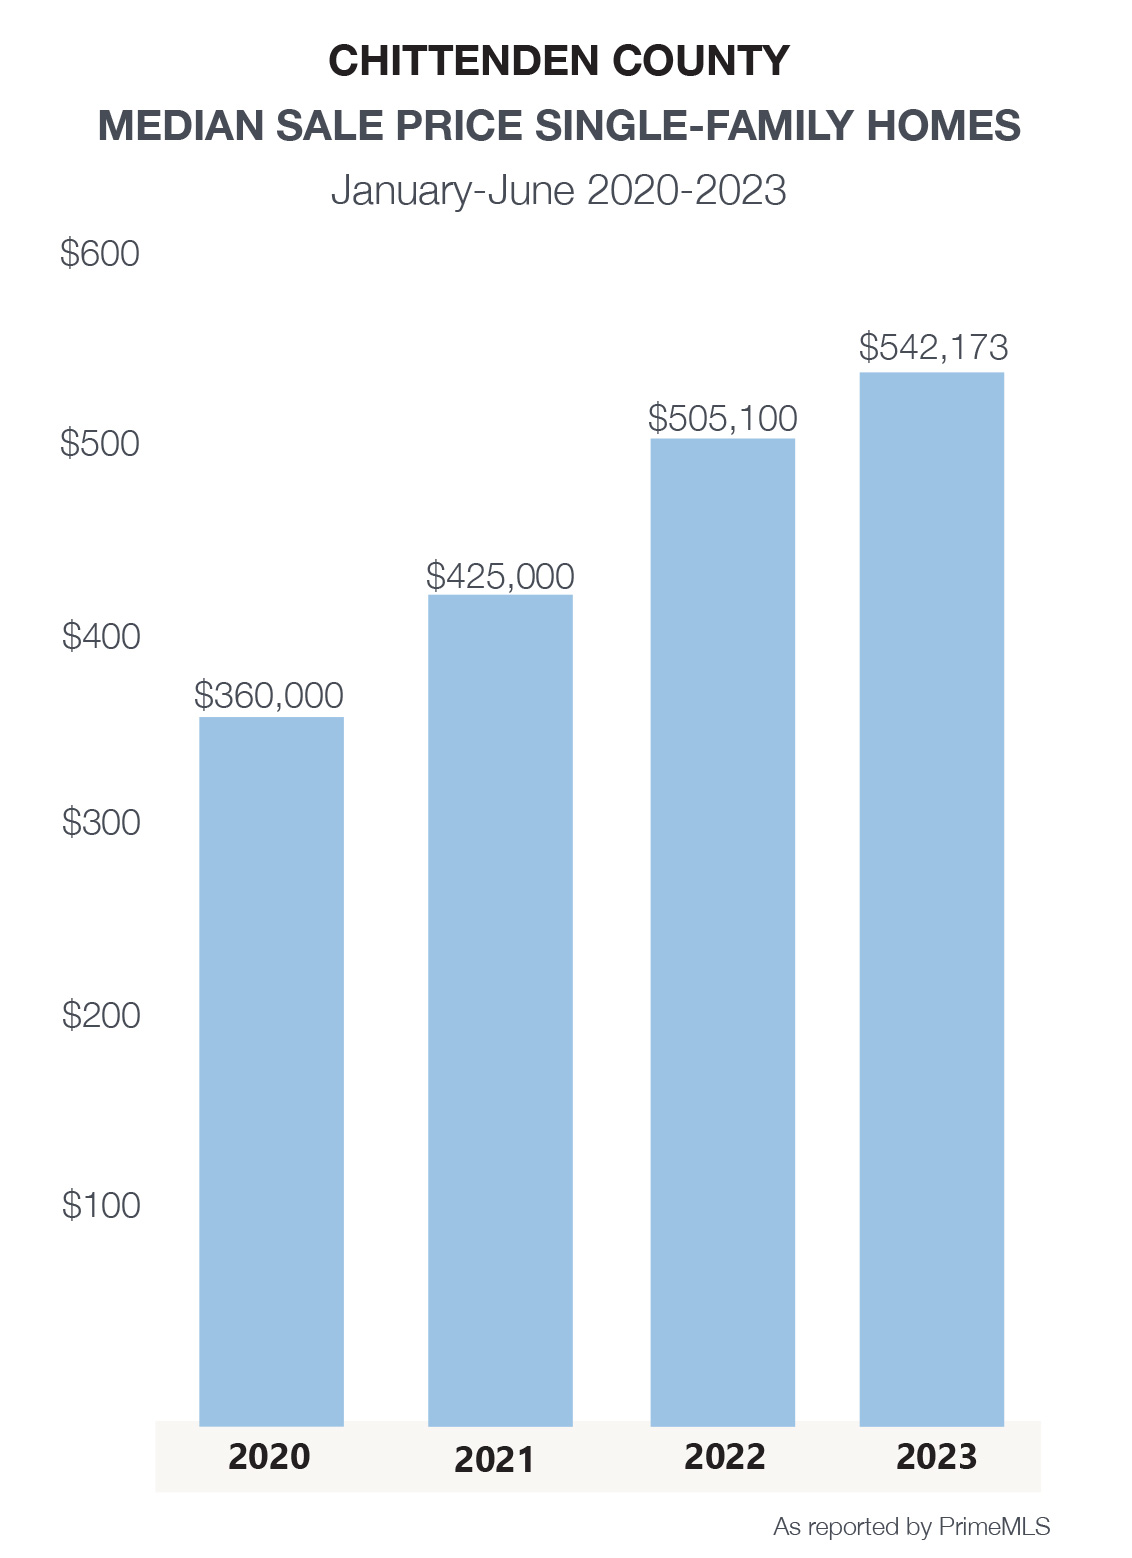
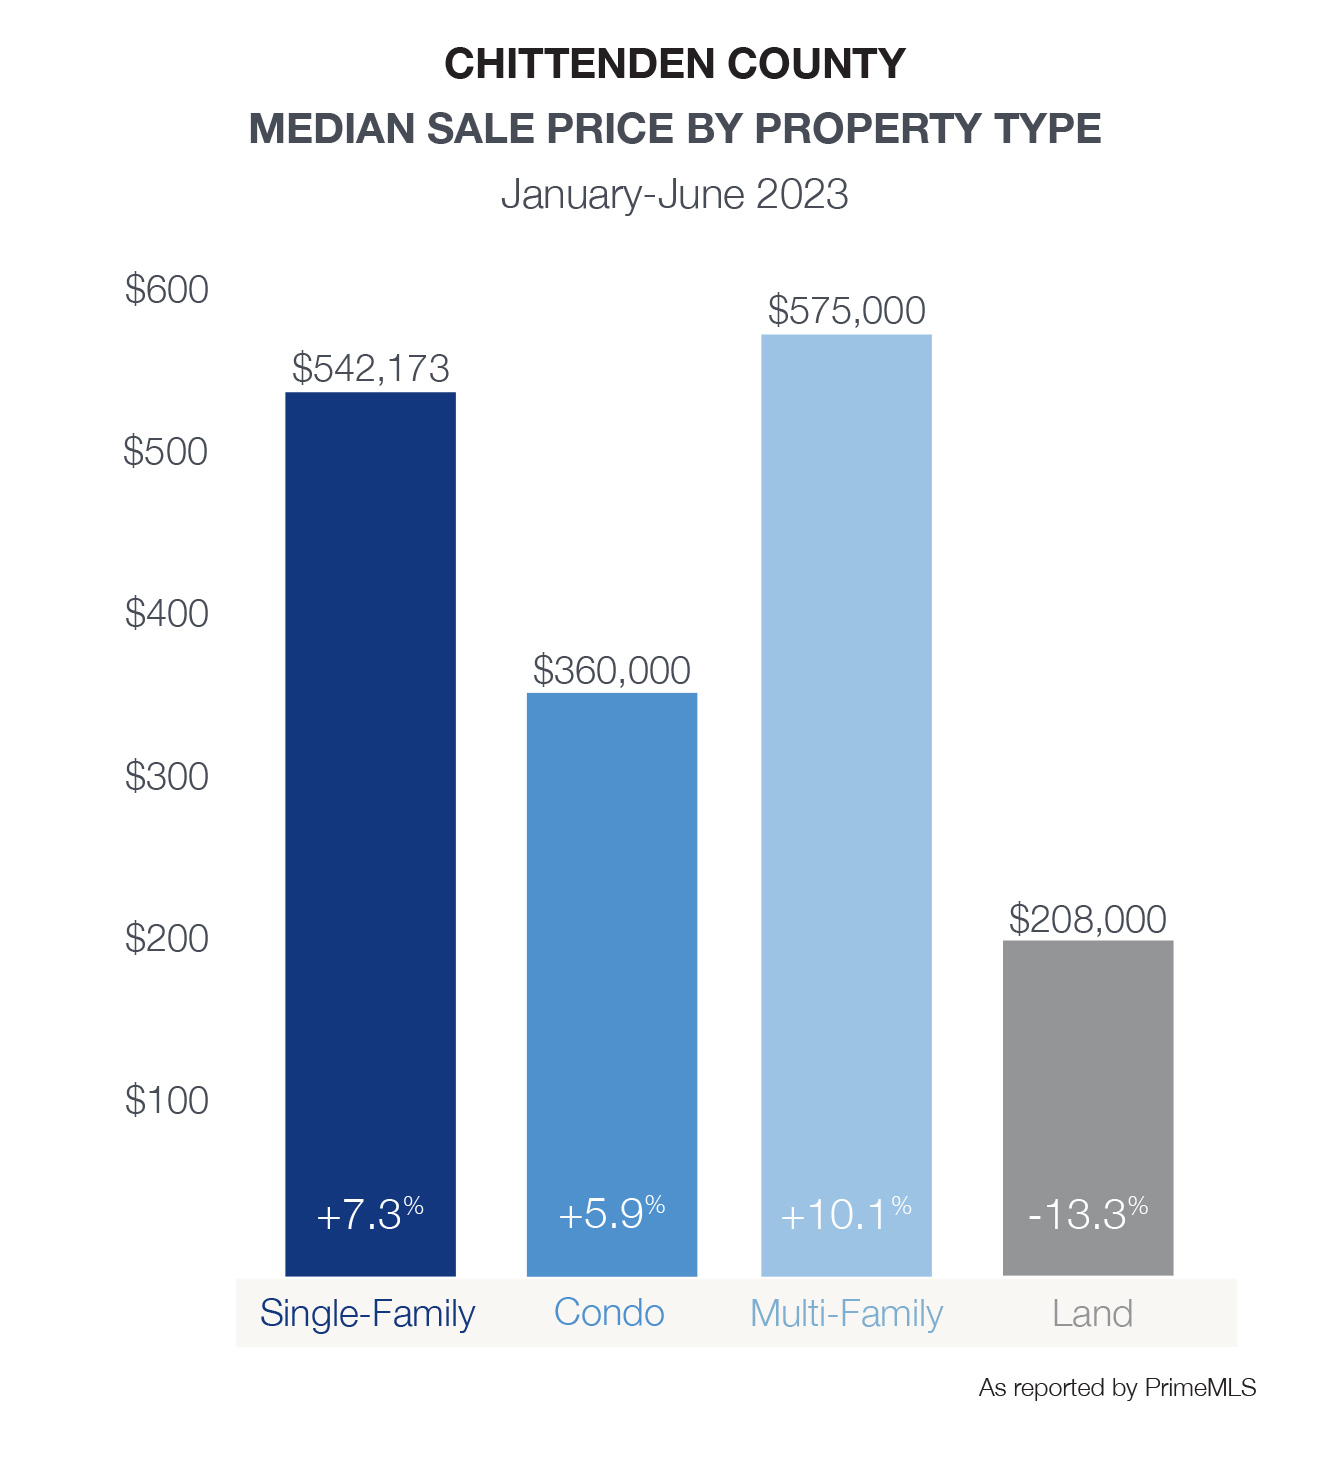
$542,173 +7.3 %
$598,638 -1.7 %
402 -17.1 %
552 -16.4 %
28 +47.4%
Condos January-June 2023
Median Sale Price:
Average Sale Price:
Units Sold:
Newly Listed:
Days on Market:
$360,000 +5.9%
$418,575 +8.5%
234 -25.2%
297 -21.0%
17 -22.7%
While prices for single family homes have increased across the county by nearly 51% since mid-year 2020, growth has moderated in 2023 at a 7% increase. Homeowners have seen increased equity over the past few years, while benefiting as the largest portion of their living expenses – their mortgage – remained stable. Year to date, although buyer demand remained strong, a drop of 16% in new listings resulted in a decline in closed sales. Some buyers, many who paused searches in the second half of 2022 due to rising interest rates, have reentered the market this spring to face competitive offers. This is more frequent in the more affordable price ranges. The decline in new listings is also beginning to moderate as lifestyle factors encourage many sellers to maximize gains and make moves long delayed since the pandemic.
Hillside East in South Burlington introduced one of the nation’s first 100% fossil fuel and carbon-free, climate resilient neighborhoods in the spring. With construction underway, a variety of single family and town home styles are available for reservation in the already established community. South Village, also in South Burlington, is wrapping up development with the last lots under construction.
In Chittenden County, Coldwell Banker Hickok & Boardman agents represented clients in more than 1 in 4 sales. Buying or selling your home is a big deal – the experience and results your Agent and real estate brokerage offer should be, too.
724 Delong Lane, Shoreham, VT ~ This well-maintained log home sits on over 1 acre, with 480 feet of lake frontage on Lake Champlain.
Single-Family January-June 2023
Median Sale Price:
Average Sale Price:
Units Sold:
Newly Listed:
Days on Market:
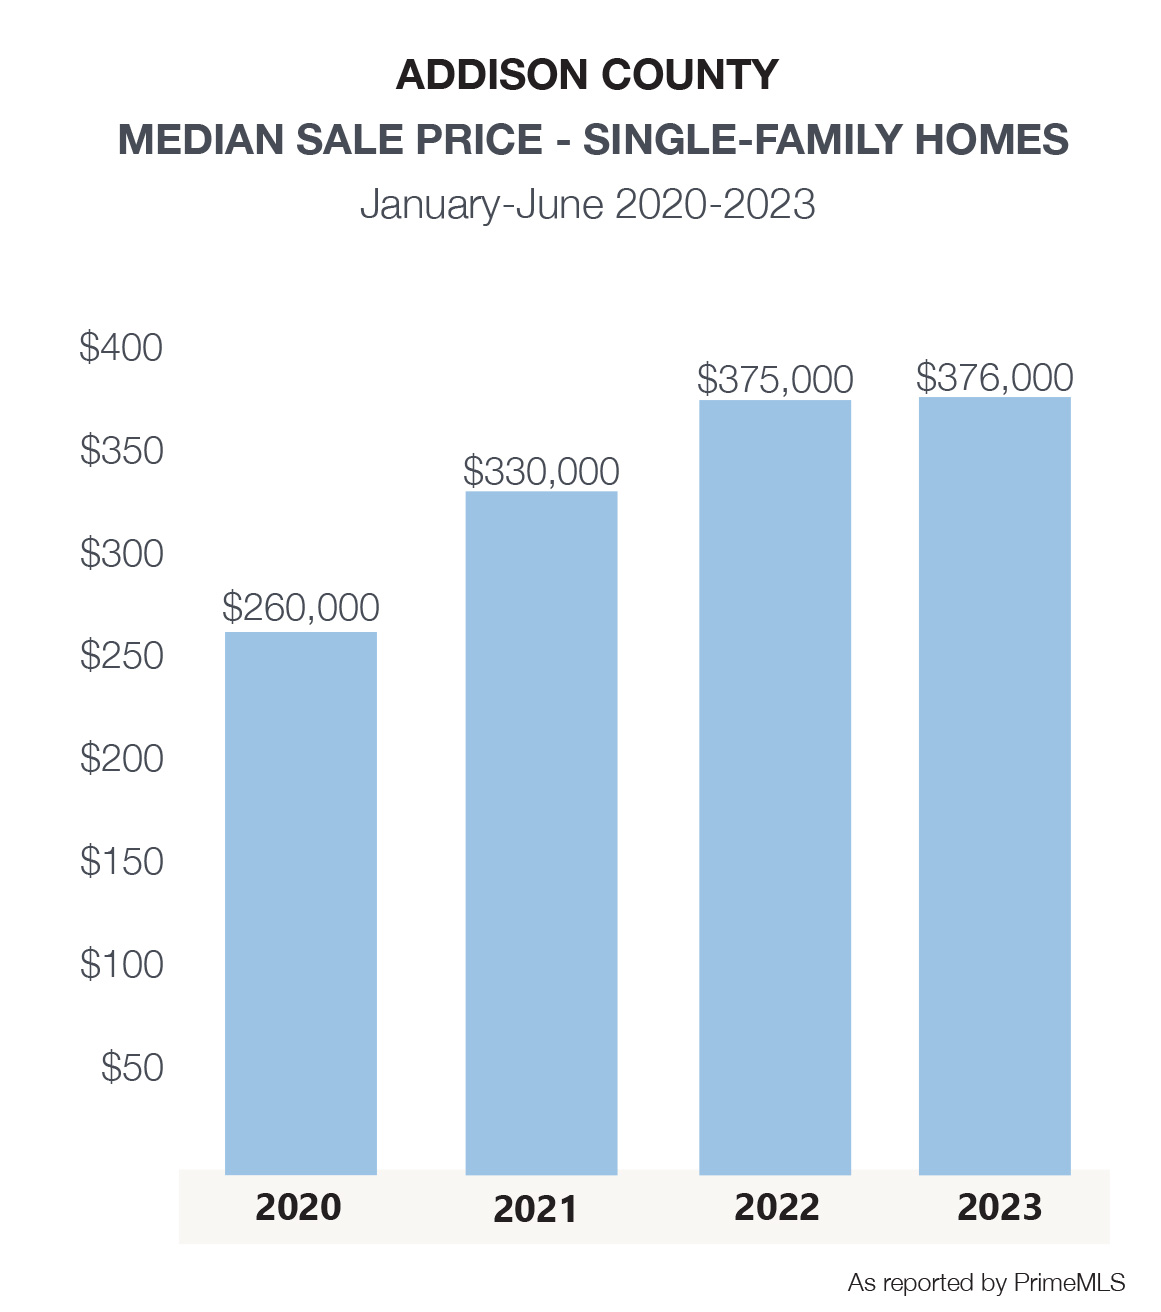
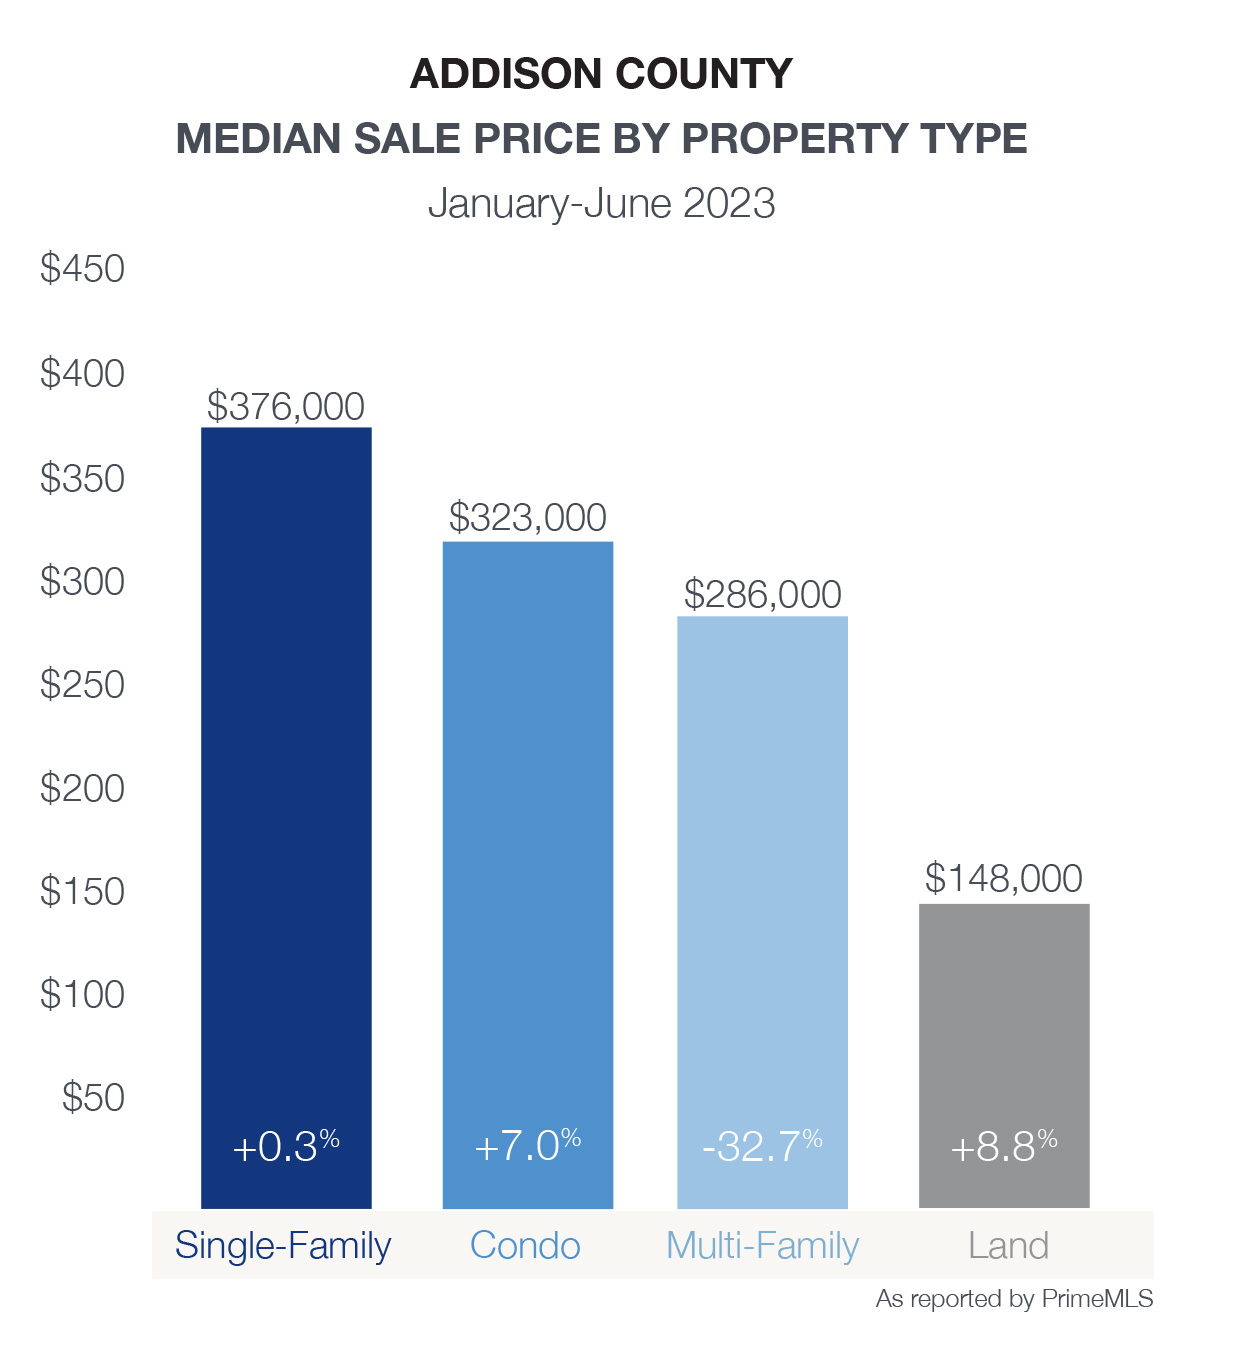
$376,000 +0.3 %
$467,149 +8.3 %
121 -10.4 %
170 -11.0 %
36 +5.9%
Condos January-June 2023
Median Sale Price:
Average Sale Price:
Units Sold:
Newly Listed:
Days on Market:
$323,000 +7.0%
$381,438 +21.2%
8 -11.1%
8 +33.3%
14 -46.2%
The real estate market in Addison County is not immune to the trends seen across other counties in this report although at a more moderate pace. The number of single-family homes sales declined by only 12 units, while the number of new listings on the market dropped by 17 units. With a small number of transactions in many towns, the data can show dramatic swings in one direction or the other.
Bristol, Ferrisburgh, Middlebury, Monkton, Orwell, and Vergennes proved the most popular with the greatest number of sales, however with far fewer new listings as compared to last year at this time. Ferrisburgh, in the northern part of the county, posted a median sale price of $529,000 – significantly higher than the county average of $376,000.
While there are few condominium sales in the county, the available parcels of land for sale increased by 21% during the first half. This resulted in 30 closed sales, the highest number of land sales in the region.
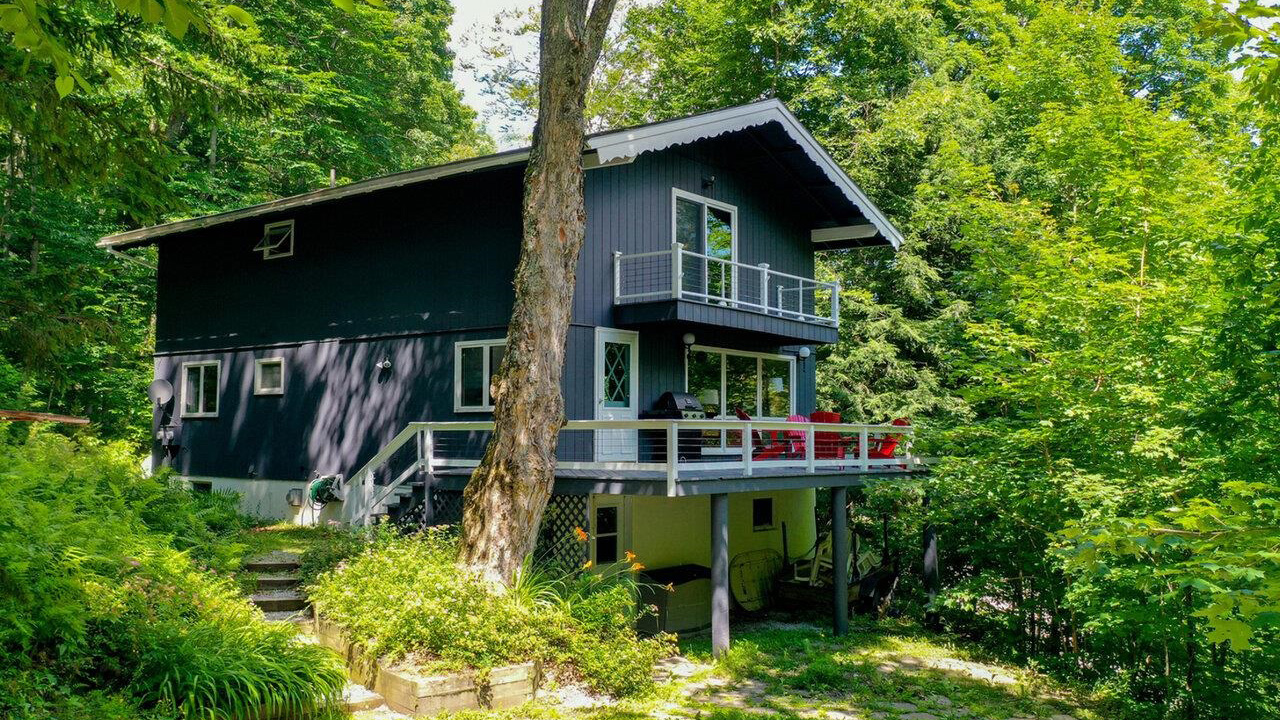
1019 Highland Drive, Montgomery, VT ~ Enjoy all 4 seasons in this secluded Chalet only 6 miles to Jay Peak Resort!.
Single-Family January-June 2023
Median Sale Price:
Average Sale Price:
Units Sold:
Newly Listed:
Days on Market:
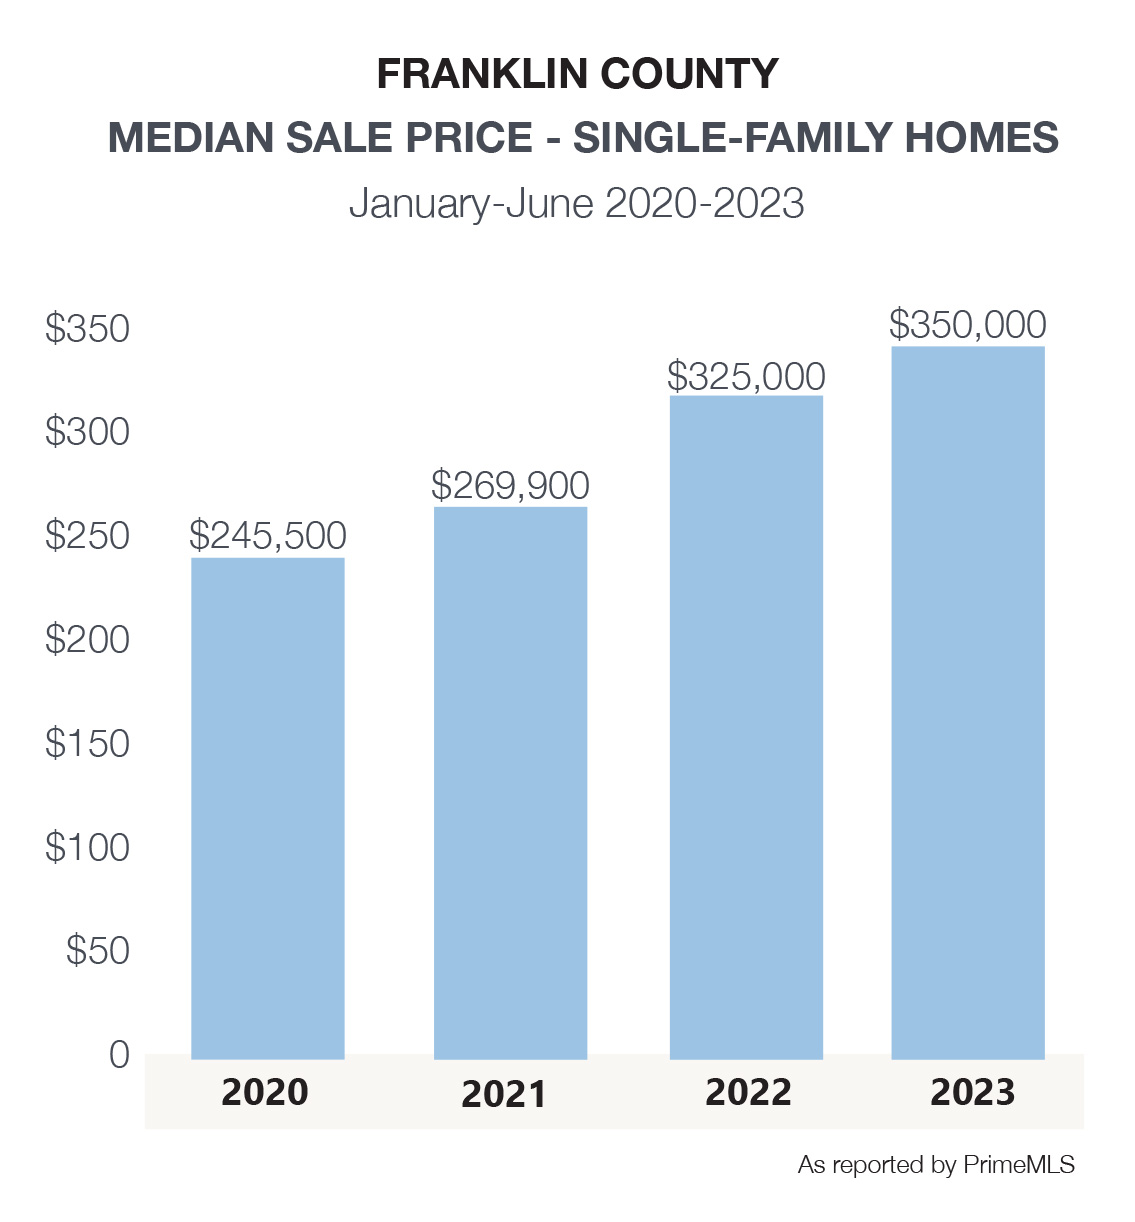
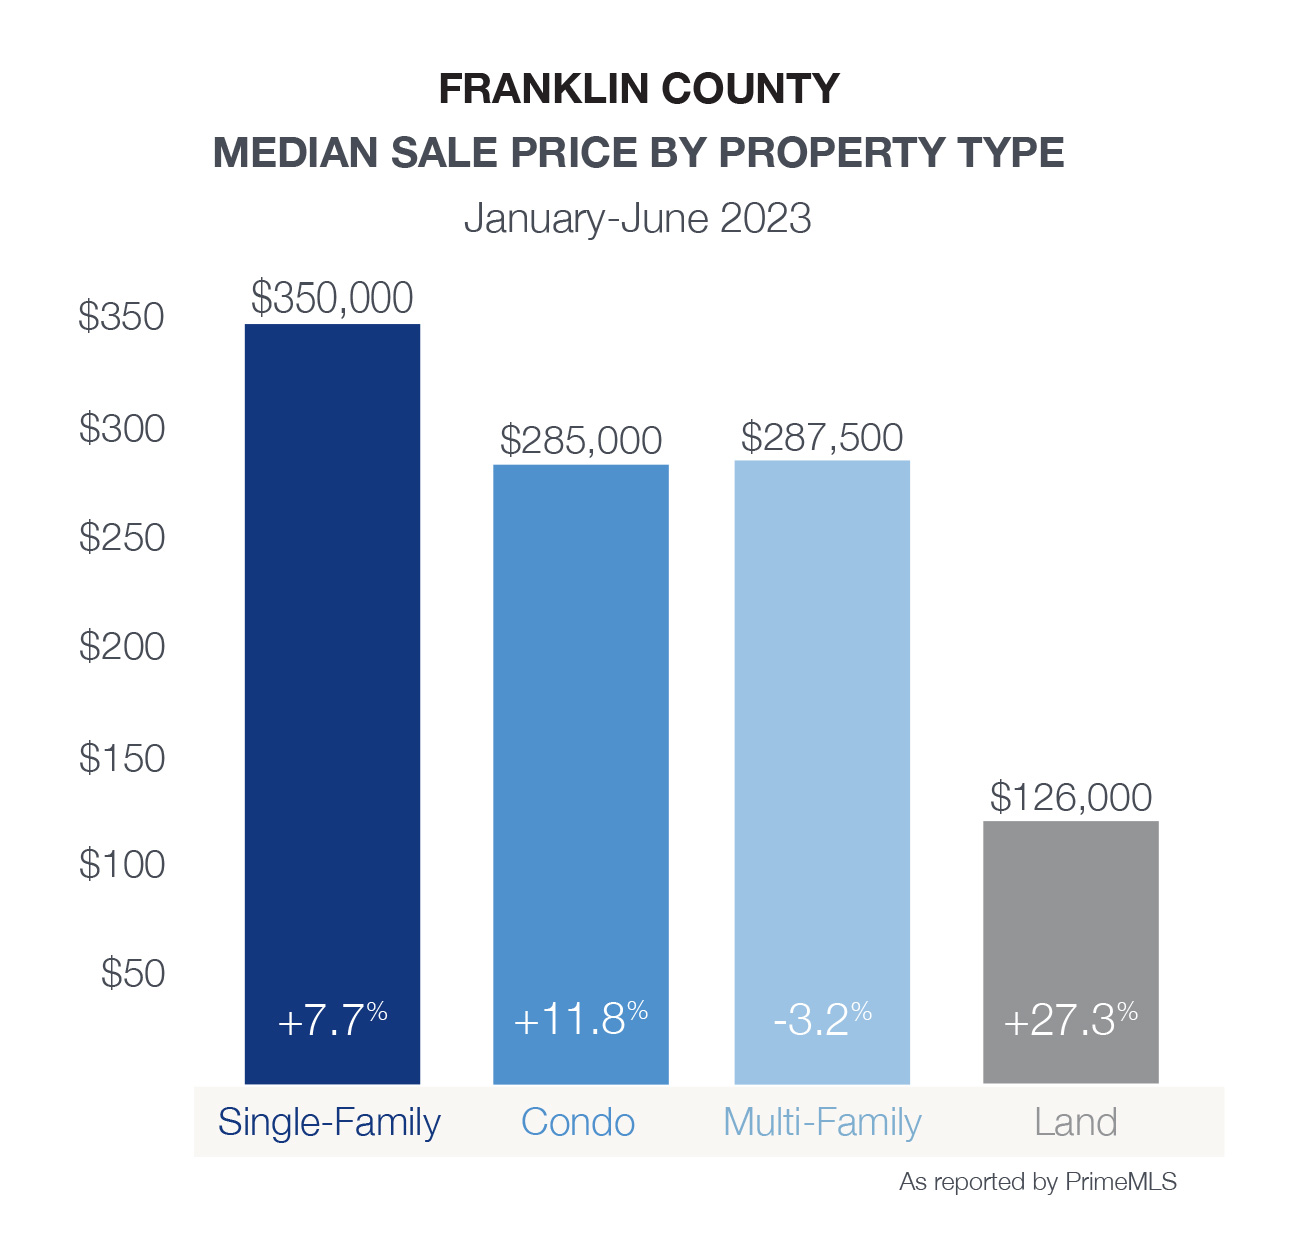
$350,000 +7.7%
$358,532 +4.0%
182 -26.9%
275 -17.2%
45 +45.0%
Single-Family January-June 2023
Median Sale Price:
Average Sale Price:
Units Sold:
Newly Listed:
Days on Market:
$285,000 +11.8%
$301,786 -6.3%
14 -39.1%
31 +29.2%
8 -81.4%
The first half of 2023 saw a decline of 27% in closed sales for single-family homes in Franklin County, compared to the same period last year. Additionally, new listings for single-family homes in the county dropped by 17% year-over-year, contributing to the limited inventory and increased competition among buyers.
Despite the challenges faced by the single-family home market in Franklin County, the median sale price for homes increased by around 8% compared to 2022, demonstrating that demand remains strong in this segment of the market. Among the counties included in this report, the median price of $350,000 positions Franklin as the most affordable. Not only is it easily accessible to I-89, but Franklin County also a variety of property types such as single family, condos, multi-family, and land for buyers to consider.
Fairfax, Georgia, Swanton post some of the highest number of sales in the county – along with an increase in the median sale price, indicating that these areas remain attractive to buyers.

 Forecasts from Lawrence Yun, the Chief Economist for National Association of Realtors, suggest a potential 14% increase in home sales this year, accompanied by modest price appreciation estimates ranging between 2.5% to 5%. Despite some buyers anticipating price declines, local market conditions driven by supply-demand imbalances do not support such expectations. Various economists and institutions, including the Mortgage Bankers Association and Fannie Mae, predict mortgage rates hovering around 6% to 6.5%, a level deemed acceptable by both buyers and sellers, capable of stimulating market activity. Additionally, external factors such as the presidential election year, Federal Reserve rate adjustments, and global geopolitical developments could exert further influence on the real estate landscape in 2024.
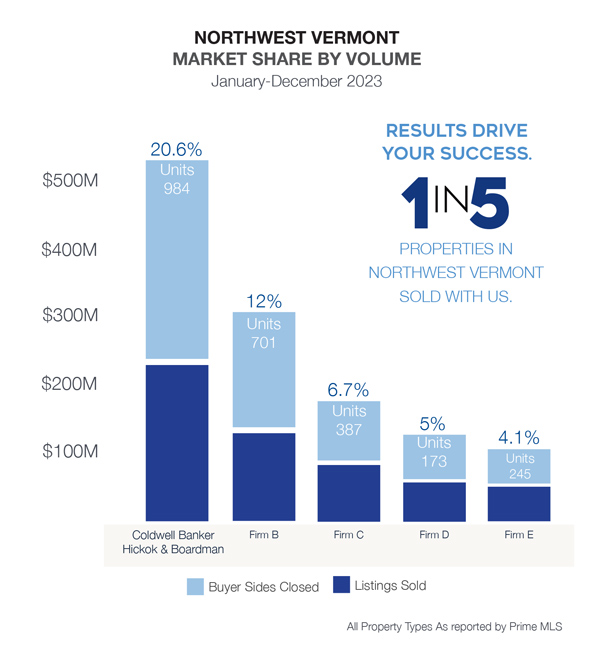


 While prices for single family homes have increased across the county by nearly 51% since mid-year 2020, growth has moderated in 2023 at a 7% increase. Homeowners have seen increased equity over the past few years, while benefiting as the largest portion of their living expenses – their mortgage – remained stable. Year to date, although buyer demand remained strong, a drop of 16% in new listings resulted in a decline in closed sales. Some buyers, many who paused searches in the second half of 2022 due to rising interest rates, have reentered the market this spring to face competitive offers. This is more frequent in the more affordable price ranges. The decline in new listings is also beginning to moderate as lifestyle factors encourage many sellers to maximize gains and make moves long delayed since the pandemic.