| Washington County | Monthly | Home Search |
|---|---|---|
| Barre City | Monthly Report | Search Barre City Homes for Sale |
| Barre Town | Monthly Report | Search Barre Town Homes for Sale |
| Berlin | Monthly Report | Search Berlin Homes for Sale |
| Cabot | Monthly Report | Search Cabot Homes for Sale |
| Calais | Monthly Report | Search Calais Homes for Sale |
| Duxbury | Monthly Report | Search Duxbury Homes for Sale |
| East Montpelier | Monthly Report | Search East Montpelier Homes for Sale |
| Fayston | Monthly Report | Search Fayston Homes for Sale |
| Marshfield | Monthly Report | Search Marshfield Homes for Sale |
| Middlesex | Monthly Report | Search Middlesex Homes for Sale |
| Montpelier | Monthly Report | Search Middlesex Homes for Sale |
| Moretown | Monthly Report | Search Moretown Homes for Sale |
| Northfield | Monthly Report | Search Northfield Homes for Sale |
| Plainfield | Monthly Report | Search Plainfield Homes for Sale |
| Waitsfield | Monthly Report | Search Waitsfield Homes for Sale |
| Warren | Monthly Report | Search Warren Homes for Sale |
| Waterbury | Monthly Report | Search Waterbury Homes for Sale |
 About Coldwell Banker Hickok & Boardman
Grand Isle County Towns Monthly & Quarterly Updates
| Towns | Monthly Report Link | Search Homes for Sale by Town |
|---|---|---|
| Alburgh | Monthly Report | Search Homes for Sale |
| Grand Isle | Monthly Report | Search Homes for Sale |
| Isle la Motte | Monthly Report | Search Homes for Sale |
| North Hero | Monthly Report | Search Homes for Sale |
| South Hero | Monthly Report | Search Homes for Sale |
Addison County Towns Monthly & Quarterly Updates
| Towns | Monthly Report Link | Search Homes for Sale by Town |
|---|---|---|
| Addison | Monthly Report | Search Homes for Sale |
| Bridport | Monthly Report | Search Homes for Sale |
| Bristol | Monthly Report | Search Homes for Sale |
| Cornwall | Monthly Report | Search Homes for Sale |
| Ferrisburgh | Monthly Report | Search Homes for Sale |
| Leicester | Monthly Report | Search Homes for Sale |
| Lincoln | Monthly Report | Search Homes for Sale |
| Middlebury | Monthly Report | Search Homes for Sale |
| Monkton | Monthly Report | Search Homes for Sale |
| Orwell | Monthly Report | Search Homes for Sale |
| Shoreham | Monthly Report | Search Homes for Sale |
| Starksboro | Monthly Report | Search Homes for Sale |
| Vergennes | Monthly Report | Search Homes for Sale |
Franklin County Towns Monthly & Quarterly Updates
| Towns | Monthly Report Link | Search Homes for Sale by Town |
|---|---|---|
| Bakersfield | Monthly Report | Search Homes for Sale |
| Enorburg | Monthly Report | Search Homes for Sale |
| Fairfax | Monthly Report | Search Homes for Sale |
| Fairfield | Monthly Report | Search Homes for Sale |
| Fletcher | Monthly Report | Search Homes for Sale |
| Franklin | Monthly Report | Search Homes for Sale |
| Georgia | Monthly Report | Search Homes for Sale |
| Highgate | Monthly Report | Search Homes for Sale |
| Montgomery | Monthly Report | Search Homes for Sale |
| Richford | Monthly Report | Search Homes for Sale |
| Sheldon | Monthly Report | Search Homes for Sale |
| St Albans City | Monthly Report | Search Homes for Sale |
| St Albans Town | Monthly Report | Search Homes for Sale |
| Swanton | Monthly Report | Search Homes for Sale |
Vermont Mortgage Update
Ranjit “Buddy” Singh, NMLS 92046
Buddy@SpruceMortgage.com
Julie Thorpe NMLS# 92216
Julie@SpruceMortgage.com
There was positive news for mortgage rates which ended 2023 at the low 6% range as the market cheered lower inflation. Rates have moved slightly higher since then, as there are questions with the size, timing, and quantity of Fed rate cuts in the coming year. Freddie Mac expects rates to remain in 6-7% range for 2024, higher than other industry and market participants are estimating. Historically, there have been momentary dips in mortgage rates based on reactions to economic data so it is important to have a very responsive and attentive mortgage representative who has access to live markets this year.
We saw notable changes in the lending environment in 2023. As a recap, FHA ended life of loan mortgage insurance for buyers with 10% down. Fannie Mae added a 5% down payment option for qualified borrowers on 2-4 unit primary residence. This indicates Fannie Mae’s understanding that many homebuyers are priced out of this market, and the income from a multi-unit property provides a path to homeownership. We also saw changes in loan level price adjustments for first time home buyers to offset the rise in rates.
We saw other trends in 2023 that have helped homebuyers access the American dream. There was an increase in borrowers using cosigners, having larger down payments and receiving gifts from family members to make homes more affordable. Multiple homebuyers combining resources to qualify for a multi-unit instead of renting has also become more popular. This strategy increases buying power and helps bolster each partner’s long term financial planning goals.
The mortgage “lock in effect,” where homeowners are locked into a rate lower than 4%, will continue to strain inventory. This creates a reduction of both buyers and sellers, as current homeowners are reluctant to sell and find a different home at a higher rate. Any reduction in mortgage rates should help alleviate some of this log jam.
Forecasting into 2024, we will most likely be seeing more programs become available as lenders adjust their guidelines and overlays to accommodate buyers and adjust for a continued seller’s market. There continues to be a need to bring new buyers into the housing market by some non-traditional paths. Educating another generation of homeowners on these new programs and developments will be of paramount importance. Continued outreach and education will strengthen the industry’s ability to keep opening doors for Vermont homeowners.
Spruce Disclaimer: The information in this report is for informational purposes only and does not represent an offer or commitment to provide any product or service. Any rate quotes, prices or the physical information included have been obtained from sources believed to be reliable, but we do not guarantee their accuracy or completeness. Any mentions of third-party names, products, and services are for referential purposes only and are not meant to imply any sponsorship, endorsement, or affiliation unless otherwise noted. This information is based on current market conditions and is subject to change without notice
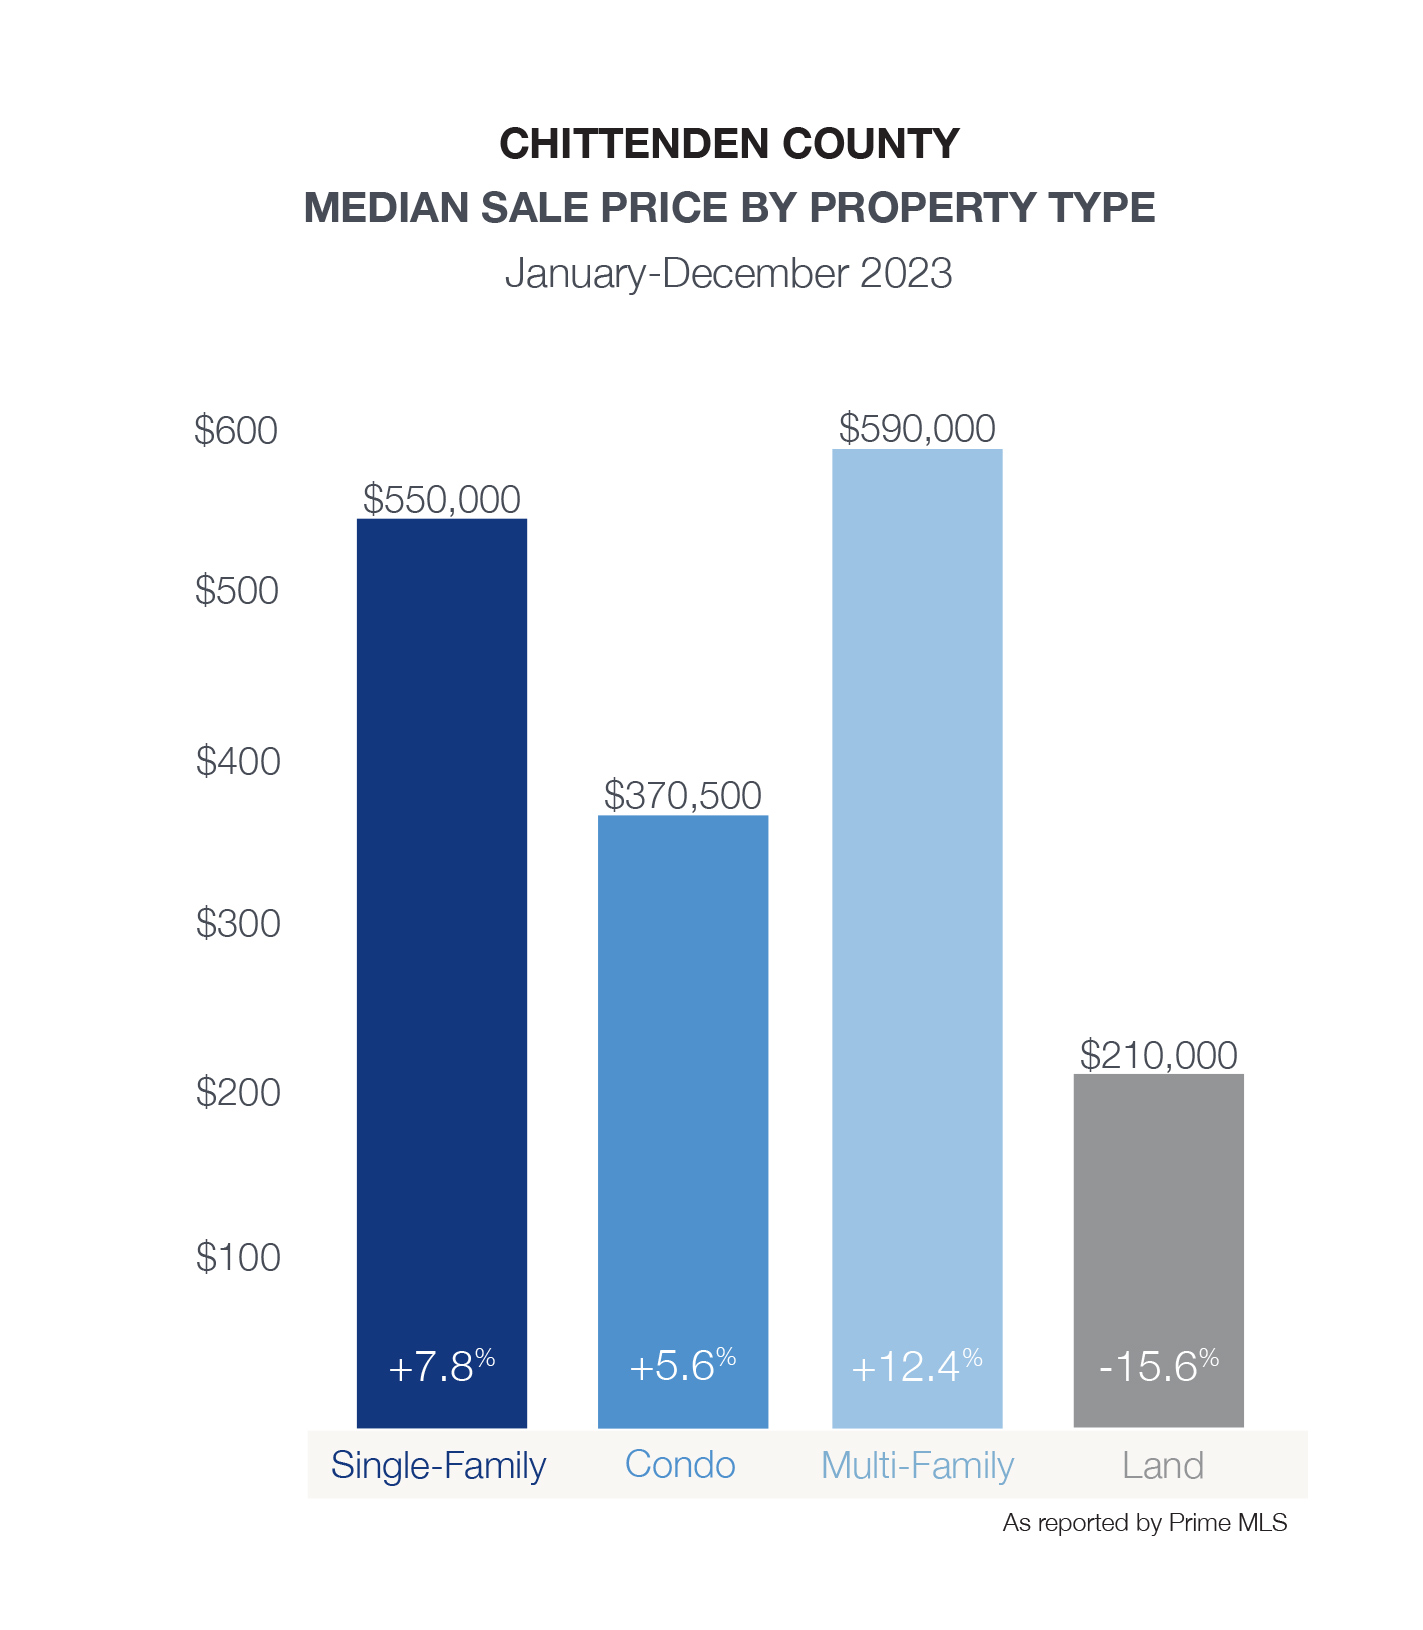
Chittenden County Market Results

| Single-Family January-December 2023 | ||||
|---|---|---|---|---|
| Median Sale Price: | Average Sale Price: | Units Sold: | Newly Listed: | Days on Market: |
| $550,000 +7.8% | $610,596 +3.1% | 967 -14.6% | 1,110 -11.4% | 25 +31.6% |
| Condos January-December 2023 | ||||
|---|---|---|---|---|
| Median Sale Price: | Average Sale Price: | Units Sold: | Newly Listed: | Days on Market: |
| $370,500 +5.6% | $414,177 +6.0% | 501 -22.1% | 570 -11.4% | 22 +10.0% |
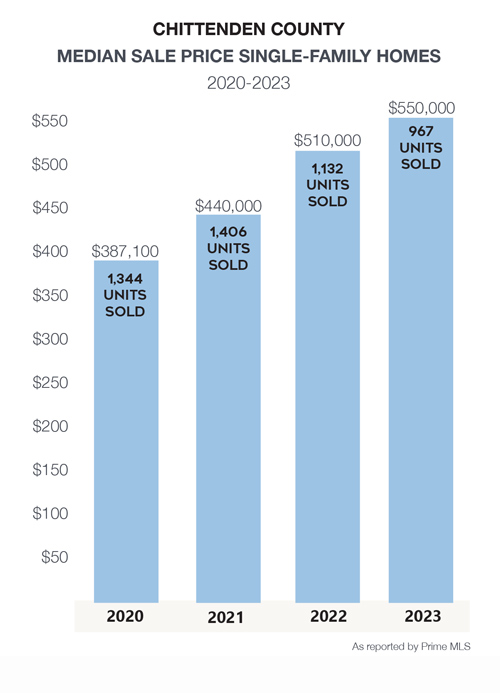
 While prices for single-family homes have increased across the county by 42% since 2020, growth has moderated in 2023 at a 7% increase. Homeowners have seen increased equity over the past few years, while benefiting as the largest portion of their living expenses – their mortgage – remained stable. Although buyer demand remained strong, a drop of 11% in new listings resulted in a decline of closed sales.
Some buyers, many who paused searches due to rising interest rates, will reenter the market this spring to face competitive offers. This is more frequent in the more affordable price ranges. The decline in new listings is predicted to moderate as lifestyle factors encourage many sellers to maximize gains and make long delayed moves.
Several new construction projects in the county neared completion in 2023 which affected the new inventory coming to market as well as the number of closed sales. In the spring, Hillside East in South Burlington introduced one of the nation’s first 100% fossil fuel and carbon-free, climate resilient neighborhoods. With construction well underway, and more than a dozen homes scheduled for completion and closing by this summer, a variety of single-family homes and townhomes are available for reservation in the already established community.
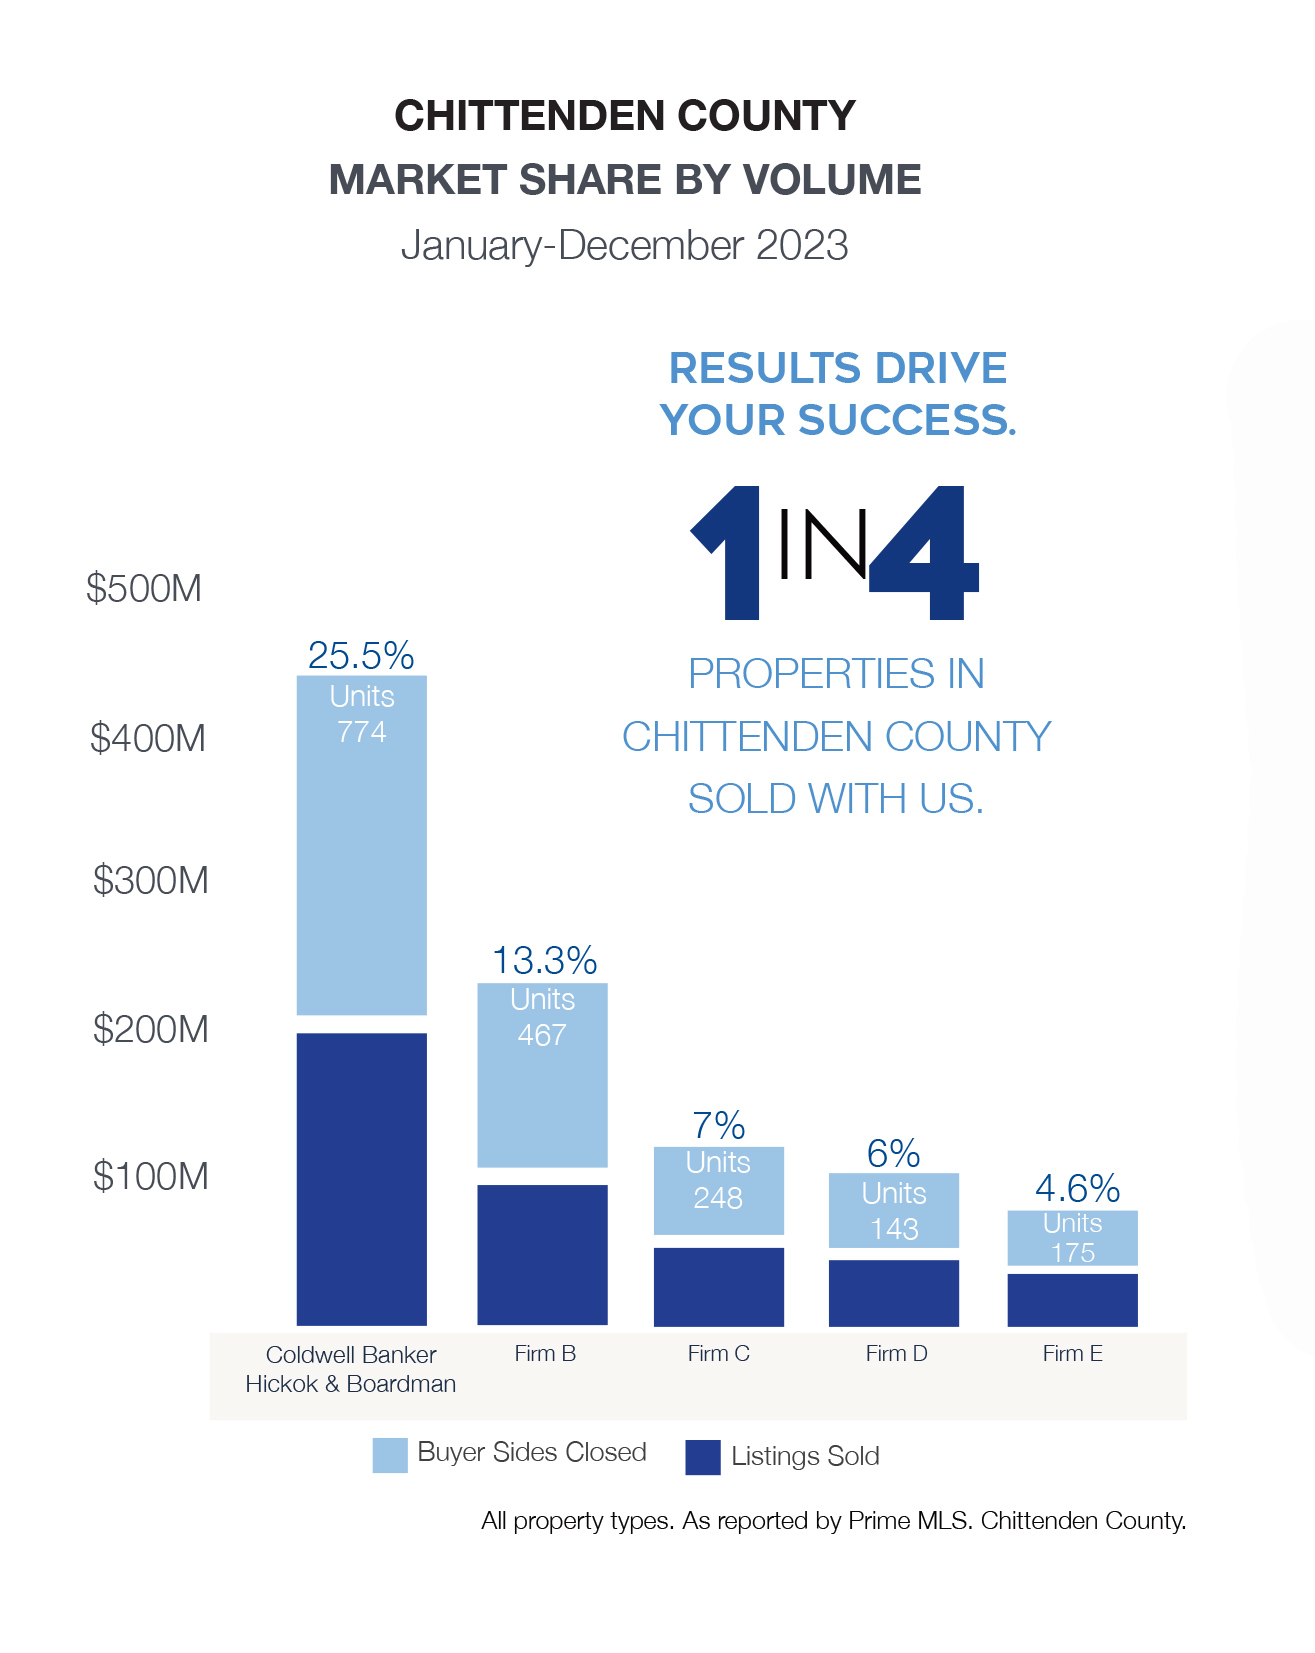
In Chittenden County, Coldwell Banker Hickok & Boardman Agents represented clients in more than 1 in 4 sales. Buying or selling your home is a big deal – the experience and results your Agent and real estate brokerage offer should be, too.
| MEDIAN SALE PRICE | VS 2022 | UNITS SOLD | VS 2022 | NEWLY LISTED | VS 2022 | DAYS ON MARKET | |
|---|---|---|---|---|---|---|---|
| Chittenden County Single-Family | $550,000 | 7.80% | 967 | -14.60% | 1110 | 11.10% | 25 |
| Bolton | $521,000 | -14.00% | 8 | 100.00% | 9 | 0.10% | 18 |
| Burlington | $565,000 | 8.70% | 142 | -25.70% | 158 | 1.60% | 27 |
| Charlotte | $852,500 | 21.80% | 28 | -31.70% | 37 | 0.40% | 34 |
| Colchester | $497,500 | 2.70% | 108 | -1.80% | 143 | 1.40% | 25 |
| Essex | $485,000 | 7.80% | 134 | -26.00% | 139 | 1.40% | 28 |
| Hinesburg | $578,500 | 19.30% | 30 | -30.20% | 36 | 0.40% | 14 |
| Huntington | $446,000 | 33.20% | 6 | -72.70% | 7 | 0.10% | 12 |
| Jericho | $548,000 | 11.80% | 40 | 14.30% | 54 | 0.50% | 15 |
| Milton | $454,750 | 9.10% | 94 | 19.00% | 100 | 1.00% | 36 |
| Richmond | $705,000 | 41.40% | 25 | 4.20% | 28 | 0.30% | 17 |
| Shelburne | $725,000 | -5.20% | 57 | -32.90% | 65 | 0.70% | 29 |
| South Burlington | $632,450 | 4.50% | 145 | 4.30% | 167 | 1.70% | 19 |
| St. George | $681,000 | 69.50% | 7 | 75.00% | 5 | 0.10% | 53 |
| Underhill | $620,000 | 15.20% | 29 | 20.80% | 33 | 0.30% | 17 |
| Westford | $584,000 | 38.10% | 14 | -12.50% | 19 | 0.20% | 10 |
| Williston | $608,000 | 0.90% | 73 | -27.00% | 82 | 0.80% | 32 |
| Winooski | $375,000 | 3.30% | 27 | -20.60% | 28 | 0.30% | 16 |
| MEDIAN SALE PRICE | VS 2022 | UNITS SOLD | VS 2022 | NEWLY LISTED | VS 2022 | DAYS ON MARKET | |
|---|---|---|---|---|---|---|---|
| Chittenden County Condo | $370,500 | 5.60% | 501 | -22.10% | 570 | -11.40% | 22 |
| Bolton | $283,000 | 9.40% | 5 | -50.00% | 6 | -45.50% | 4 |
| Burlington | $369,250 | -7.70% | 90 | -32.30% | 97 | -32.20% | 21 |
| Charlotte | $620,000 | 67.60% | 1 | 0.00% | 2 | 100.00% | 0 |
| Colchester | $373,500 | 13.20% | 54 | -22.90% | 55 | -14.10% | 22 |
| Essex | $365,000 | 7.40% | 85 | -20.60% | 101 | 1.00% | 11 |
| Hinesburg | $290,000 | -27.70% | 3 | -70.00% | 4 | -63.60% | 4 |
| Jericho | $375,000 | 28.60% | 5 | 150.00% | 8 | 700.00% | 6 |
| Milton | $345,000 | 26.40% | 23 | 53.30% | 35 | 45.80% | 126 |
| Richmond | $355,000 | 4.40% | 1 | -50.00% | 1 | -50.00% | 7 |
| Shelburne | $599,466 | 39.40% | 28 | 21.70% | 28 | 33.30% | 50 |
| South Burlington | $340,000 | 3.00% | 130 | -33.70% | 148 | -22.10% | 13 |
| Williston | $435,000 | 4.80% | 55 | -6.80% | 60 | 0.00% | 16 |
| Winooski | $365,000 | 1.10% | 21 | 40.00% | 25 | 66.70% | 12 |
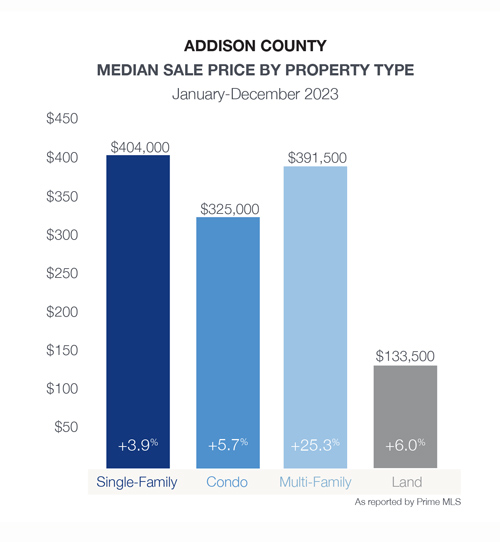
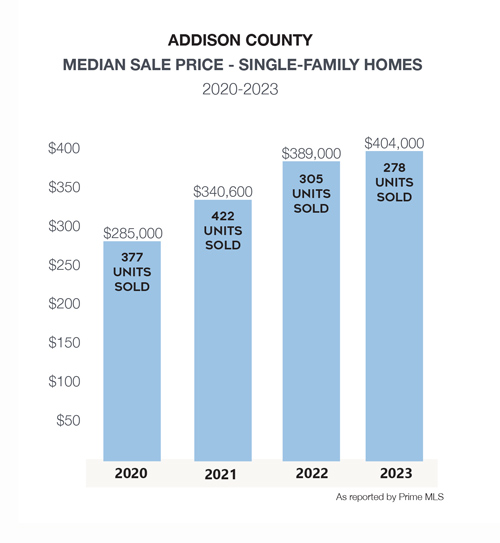
Addison County Market Results
| Single-Family January-December 2023 | ||||
|---|---|---|---|---|
| Median Sale Price: | Average Sale Price: | Units Sold: | Newly Listed: | Days on Market: |
| $404,000 +3.9% | $490,373 +6.8% | 278 -8.9% | 319 -7.5% | 30 -6.3% |
| Condos January-December 2023 | ||||
|---|---|---|---|---|
| Median Sale Price: | Average Sale Price: | Units Sold: | Newly Listed: | Days on Market: |
| $325,000 +5.7% | $361,542 +2.0% | 18 0.0% | 20 +53.9% | 22 -8.3% |
The real estate market in Addison County is not immune to the trends seen across other counties in this report although at a more moderate pace. The number of single-family homes sales declined by 27 units, while the number of new listings on the market dropped by 26 units.
The median sale price increased by nearly 4% in 2023, with a cumulative increase of 42% since 2020. Panton, Leicester, Weybridge, and Cornwall posted significantly higher median sale prices than the county median of $404,000.
Middlebury, Bristol, Ferrisburgh, Monkton, Orwell, and Vergennes proved the most popular with the greatest number of sales, however far fewer new listings as compared to last year.
With a small number of transactions in many towns, the data can show dramatic swings in one direction or the other.
| MEDIAN SALE PRICE | VS 2022 | UNITS SOLD | VS 2022 | NEWLY LISTED | VS 2022 | DAYS ON MARKET | |
|---|---|---|---|---|---|---|---|
| Addison County Single-Family | $404,000 | 3.90% | 278 | -8.90% | 319 | -7.50% | 30 |
| Addison | $514,500 | 3.40% | 10 | -37.50% | 12 | -36.80% | 70 |
| Bridport | $300,000 | 3.50% | 11 | 57.10% | 16 | 77.80% | 13 |
| Bristol | $394,000 | 1.30% | 28 | -9.70% | 32 | -3.00% | 21 |
| Cornwall | $565,000 | -10.30% | 14 | 27.30% | 14 | 0.00% | 35 |
| Ferrisburgh | $490,000 | -14.90% | 26 | -7.10% | 30 | -3.20% | 22 |
| Goshen | $192,035 | -48.10% | 3 | -25.00% | 6 | 200.00% | 64 |
| Granville | $144,000 | -56.10% | 4 | -33.30% | 4 | -20.00% | 46 |
| Hancock | $290,000 | 28.90% | 5 | 66.70% | 6 | 100.00% | 40 |
| Leicester | $526,500 | 75.50% | 12 | -20.00% | 11 | -38.90% | 52 |
| Lincoln | $495,000 | 28.00% | 6 | -66.70% | 9 | -55.00% | 22 |
| Middlebury | $400,000 | 8.80% | 39 | -15.20% | 41 | -22.60% | 24 |
| Monkton | $424,900 | -6.60% | 17 | -22.70% | 21 | -8.70% | 8 |
| New Haven | $493,750 | 8.50% | 12 | -14.30% | 14 | -17.70% | 33 |
| Orwell | $294,500 | -25.40% | 18 | 38.50% | 19 | 26.70% | 40 |
| Panton | $1,906,500 | 515.00% | 5 | -44.40% | 6 | -33.30% | 3 |
| Ripton | $306,000 | -36.30% | 5 | 400.00% | 4 | 300.00% | 116 |
| Salisbury | $510,000 | 22.90% | 9 | -18.20% | 16 | 60.00% | 35 |
| Shoreham | $390,000 | -9.10% | 11 | 120.00% | 13 | 44.40% | 25 |
| Starksboro | $395,000 | 46.30% | 13 | 62.50% | 13 | 44.40% | 22 |
| Vergennes | $345,000 | 7.50% | 18 | -25.00% | 19 | -29.60% | 27 |
| Waltham | $499,500 | -21.20% | 4 | 300.00% | 4 | 100.00% | 9 |
| Weybridge | $533,500 | 18.00% | 6 | -25.00% | 7 | -46.20% | 41 |
| Whiting | $335,975 | 3.50% | 2 | -50.00% | 2 | -33.30% | 5 |
Franklin County Market Results
| Single-Family January-December 2023 | ||||
|---|---|---|---|---|
| Median Sale Price: | Average Sale Price: | Units Sold: | Newly Listed: | Days on Market: |
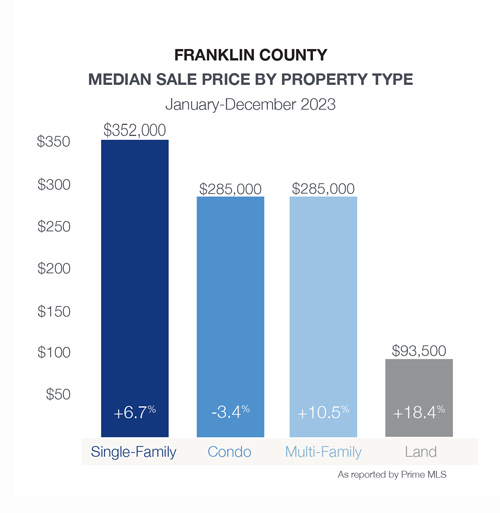
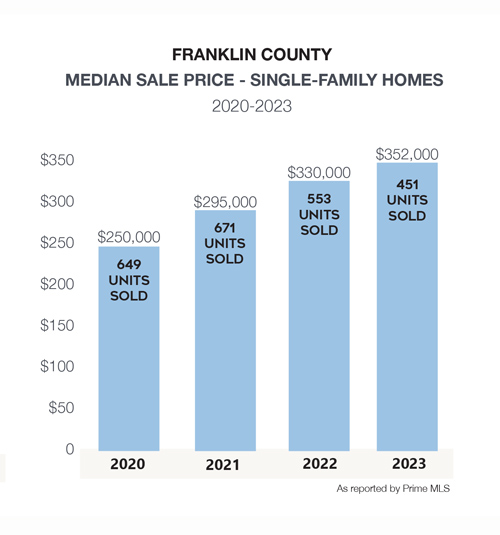
| $352,000 +6.7% | $366,898 +7.1% | 451 -18.4% | 542 -12.3% | 36 +16.1% |
| Condos January-December 2023 | ||||
|---|---|---|---|---|
| Median Sale Price: | Average Sale Price: | Units Sold: | Newly Listed: | Days on Market: |
| $285,000 -3.4% | $300,935 -3.5% | 37 -17.8% | 56 +40.0% | 12 -67.6% |
With a median sale price of $352,000, Franklin County remains the most affordable county in this report. Not only is it easily accessible to I-89, but Franklin County offers a variety of property types such as single-family, condos, multi-family, and land for buyers to consider. The robust downtown in St. Albans compliments the quintessential Vermont lifestyle offered across the rest of county.
In addition to St. Albans posting the highest number of sales – Fairfax, Georgia, and Swanton posted the largest number of sales coupled with strong increases in median sale prices indicating that these towns remain attractive to buyers.
| MEDIAN SALE PRICE | VS 2022 | UNITS SOLD | VS 2022 | NEWLY LISTED | VS 2022 | DAYS ON MARKET | |
|---|---|---|---|---|---|---|---|
| Bakersfield | $357,500 | 19.20% | 6 | -60.00% | 10 | -9.10% | 34 |
| Berkshire | $287,750 | -3.10% | 12 | -14.30% | 13 | -13.30% | 83 |
| Enosburg | $260,000 | -6.10% | 23 | -28.10% | 34 | -12.80% | 64 |
| Fairfax | $477,500 | 17.90% | 55 | 0.00% | 52 | -22.40% | 26 |
| Fairfield | $262,000 | -30.60% | 11 | 37.50% | 17 | 70.00% | 32 |
| Fletcher | $405,000 | -4.70% | 9 | 0.00% | 11 | 37.50% | 11 |
| Franklin | $265,000 | -20.30% | 11 | -38.90% | 16 | -38.50% | 94 |
| Georgia | $439,500 | 11.30% | 41 | -30.50% | 42 | -33.30% | 24 |
| Highgate | $317,500 | 5.10% | 28 | -30.00% | 30 | -31.80% | 79 |
| Montgomery | $345,000 | 13.10% | 19 | -24.00% | 27 | 8.00% | 30 |
| Richford | $210,000 | -11.40% | 29 | 20.80% | 40 | 0.00% | 63 |
| Sheldon | $340,000 | 12.60% | 15 | -11.80% | 18 | -10.00% | 18 |
| St. Albans | $340,000 | 0.00% | 119 | -20.70% | 140 | -7.90% | 20 |
| Swanton | $330,000 | 10.00% | 73 | -16.10% | 92 | -6.10% | 36 |
Grand Isle County Market Results
| Single-Family January-December 2023 | ||||
|---|---|---|---|---|
| Median Sale Price: | Average Sale Price: | Units Sold: | Newly Listed: | Days on Market: |
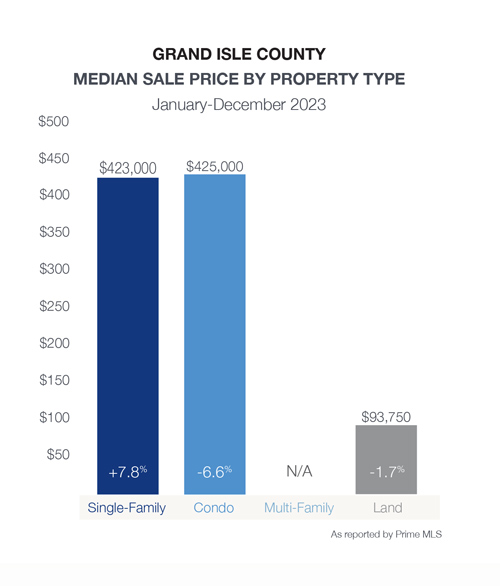
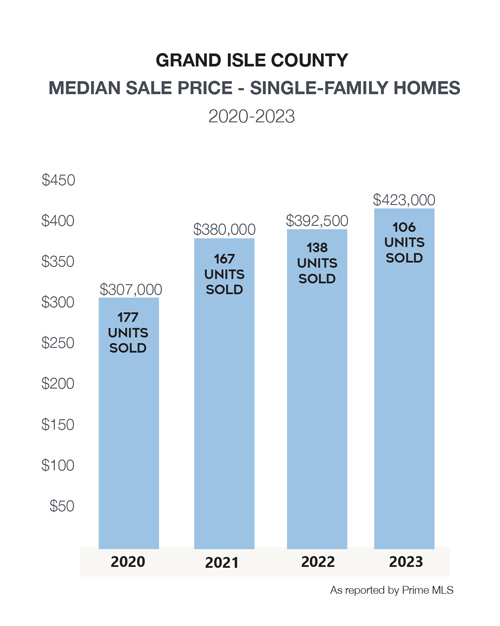
| $423,000 +7.8% | $598,858 +23.9% | 106 -23.2% | 145 -6.5% | 29 -25.6% |
| Condos January-December 2023 | ||||
|---|---|---|---|---|
| Median Sale Price: | Average Sale Price: | Units Sold: | Newly Listed: | Days on Market: |
| $425,000 -6.6% | $425,000 -6.6% | 1 0.0% | 1 -80.0% | 7 -74.1% |
With only 106 single-family homes sold in 2023, the data for Grand Isle County can be affected by smaller shifts in sales and homes coming on the market. While the number of homes sold dropped 23%, this is not a reflection of demand, but a result of the shortage of new listings. A median sale price increase of almost 8% is on par with the rest of northwest Vermont. Further, the average number of days on the market of 29 seems to indicate that buyers are ready, willing, and able to make a move when the right property becomes available.
| MEDIAN SALE PRICE | VS 2022 | UNITS SOLD | VS 2022 | NEWLY LISTED | VS 2022 | DAYS ON MARKET | |
|---|---|---|---|---|---|---|---|
| Grand Isle County Single-Family | $423,000 | 7.80% | 106 | -23.20% | 145 | -6.50% | 29 |
| Alburgh | $345,000 | 27.80% | 31 | -34.00% | 45 | -4.30% | 44 |
| Grand Isle | $505,000 | 18.80% | 27 | -6.90% | 34 | 9.70% | 32 |
| Isle La Motte | $380,000 | 14.60% | 15 | 7.10% | 19 | -13.60% | 27 |
| North Hero | $600,000 | 39.60% | 19 | -34.50% | 23 | -28.10% | 12 |
| South Hero | $754,000 | 19.70% | 14 | -26.30% | 24 | 4.40% | 13 |
Lamoille County Market Results

| Single-Family January-December 2023 | ||||
|---|---|---|---|---|
| Median Sale Price: | Average Sale Price: | Units Sold: | Newly Listed: | Days on Market: |
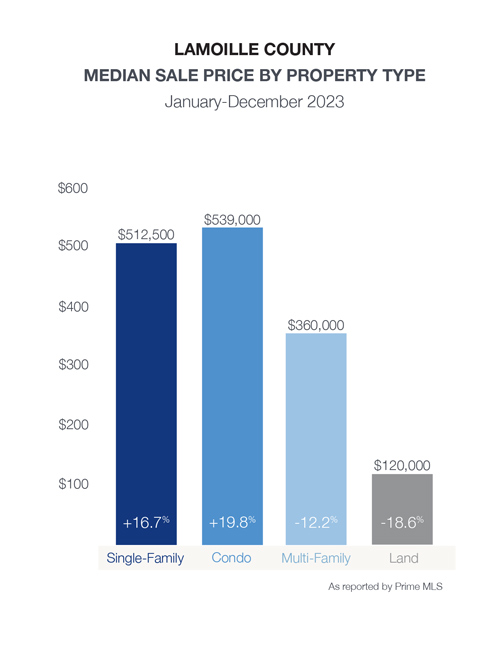
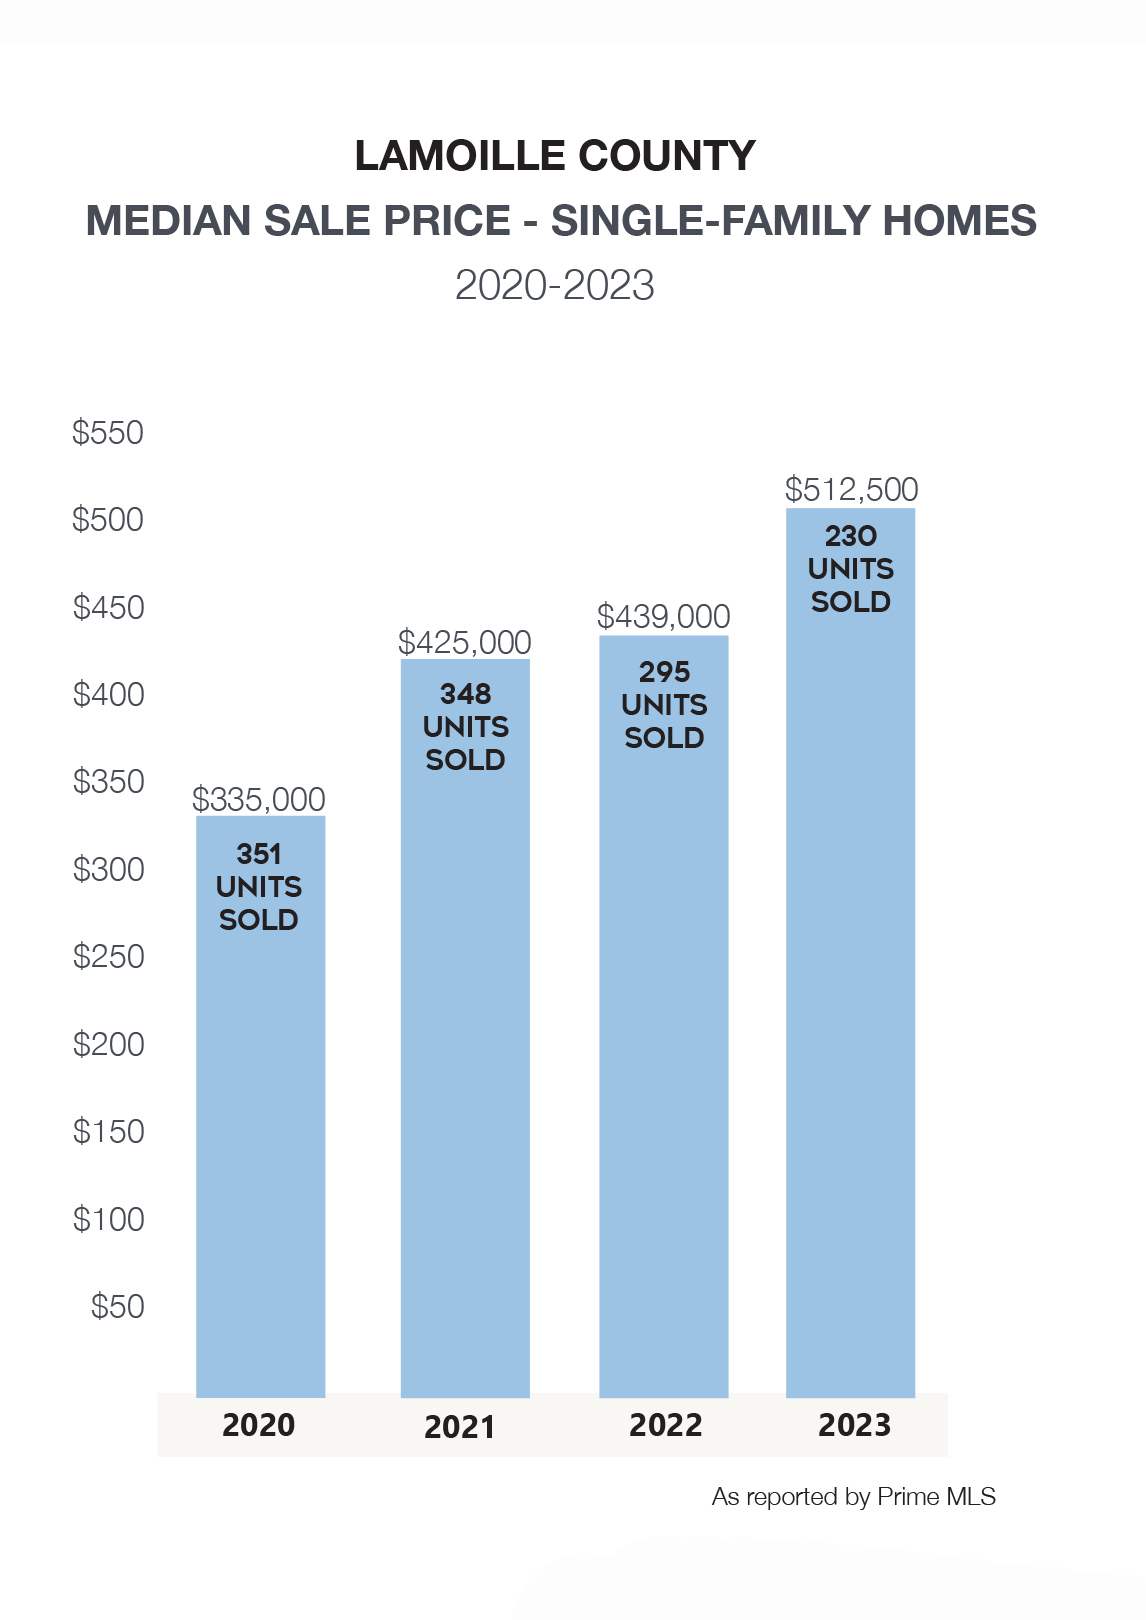
| $512,500 +16.7% | $748,400 +14.2% | 230 -22.0% | 312 +3.1% | 42 -6.7% |
| Condos January-December 2023 | ||||
|---|---|---|---|---|
| Median Sale Price: | Average Sale Price: | Units Sold: | Newly Listed: | Days on Market: |
| $539,000 +19.8% | $869,544 +44.2% | 94 -20.3% | 119 +1.2% | 87 +40.3% |
Driven by the staggering median sale price of $1,160,000 in Stowe, Lamoille County has the 2nd highest median sale price across the counties in this report. Buyer demand, coupled with a varied product mix, drove prices 17% higher for single-family homes and 20% for condos. Despite mortgage interest rates pausing buyers in other parts of the region, vacation, and luxury buyers, mostly paying cash, did not wait on the sidelines in Lamoille County. In addition to Stowe, Cambridge and Morristown posted the greatest number of both single-family homes and condos sales in the county.
| MEDIAN SALE PRICE | VS 2022 | UNITS SOLD | VS 2022 | NEWLY LISTED | VS 2022 | DAYS ON MARKET | |
|---|---|---|---|---|---|---|---|
| Lamoille County Single-Family | $512,500 | 16.70% | 230 | -22.00% | 312 | 3.10% | 42 |
| Belvidere | $420,000 | 20.00% | 3 | 3.00% | 4 | -60.00% | 31 |
| Cambridge | $402,250 | 11.70% | 32 | 32.00% | 34 | -24.40% | 27 |
| Eden | $337,500 | 32.40% | 14 | 14.00% | 23 | 15.00% | 88 |
| Elmore | $560,000 | 26.60% | 4 | 4.00% | 5 | 0.00% | 35 |
| Hyde Park | $405,700 | 23.90% | 21 | 21.00% | 21 | -44.70% | 36 |
| Johnson | $341,000 | 9.10% | 17 | 17.00% | 29 | 0.00% | 56 |
| Morristown | $436,500 | 2.50% | 44 | 44.00% | 70 | -15.70% | 38 |
| Stowe | $1,160,429 | 17.20% | 77 | 77.00% | 101 | -6.50% | 44 |
| Waterville | $242,000 | -13.60% | 5 | 5.00% | 7 | 0.00% | 15 |
| Wolcott | $365,000 | 16.80% | 13 | 13.00% | 18 | 0.00% | 42 |
| MEDIAN SALE PRICE | VS 2022 | UNITS SOLD | VS 2022 | NEWLY LISTED | VS 2022 | DAYS ON MARKET | |
|---|---|---|---|---|---|---|---|
| Lamoille County Condo | $539,000 | 19.80% | 94 | -20.30% | 119 | 1.20% | 87 |
| Cambridge | $250,000 | 111.90% | 13 | 13.00% | 18 | -21.70% | 163 |
| Morristown | $280,000 | 11.10% | 5 | 5.00% | 5 | 66.70% | 8 |
| Stowe | $737,000 | 30.40% | 76 | 76.00% | 96 | -16.50% | 79 |