
| Single Family January-June | ||||
|---|---|---|---|---|
| Median Sale Price: | Average Sale Price: | Units Sold: | Newly Listed: | Days on Market: |
| $280,000 +8.2% | $365,113 +23.8% | 115 +2.7% | 170 -11.5% | 147 +12.2% |
Early 2026 Market Report
| Single Family January-June | ||||
|---|---|---|---|---|
| Median Sale Price: | Average Sale Price: | Units Sold: | Newly Listed: | Days on Market: |
| $280,000 +8.2% | $365,113 +23.8% | 115 +2.7% | 170 -11.5% | 147 +12.2% |
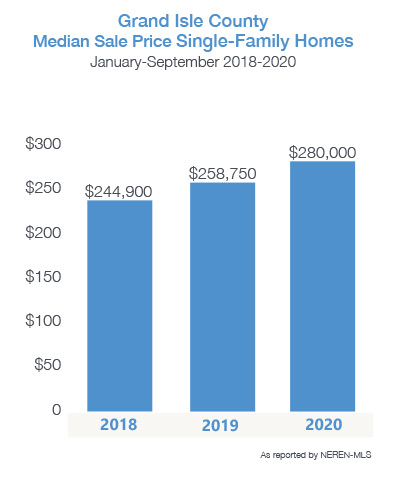
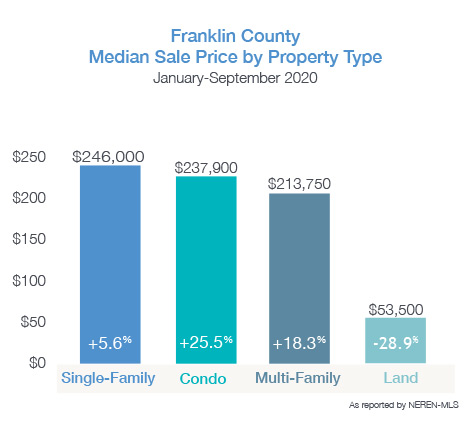
| Single-Family January-September 2020 | ||||
|---|---|---|---|---|
| Median Sale Price: | Average Sale Price: | Units Sold: | Newly Listed: | Days on Market: |
| $246,000 +5.6% | $252,186 +7.8% | 468 +12.2% | 591 -11% | 94 -3.1% |
| Condo January-September 2020 | ||||
|---|---|---|---|---|
| Median Sale Price: | Average Sale Price: | Units Sold: | Newly Listed: | Days on Market: |
| $237,900 +25.5% | $234,405 +17% | 58 +52.6% | 60 +13.2% | 76 -40.6% |
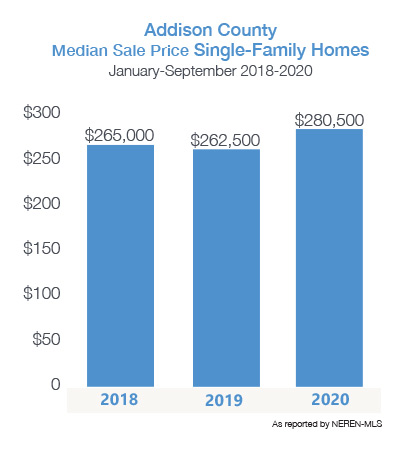
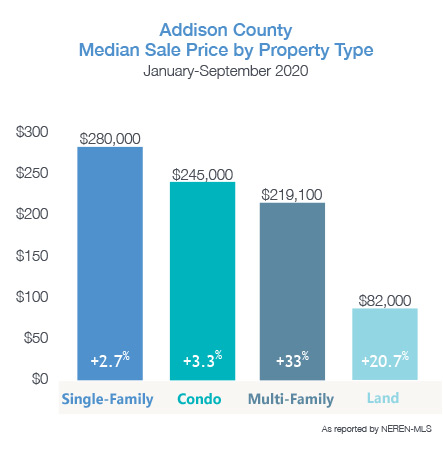
| Single-Family January-September 2020 | ||||
|---|---|---|---|---|
| Median Sale Price: | Average Sale Price: | Units Sold: | Newly Listed: | Days on Market: |
| $280,500 +6.9% | $305,414 -0.5% | 267 -5.7% | 347 -22.2% | 112 -2.6% |
| Condo January-September 2020 | ||||
|---|---|---|---|---|
| Median Sale Price: | Average Sale Price: | Units Sold: | Newly Listed: | Days on Market: |
| $245,000 +26% | $257,869 +25.4% | 13 -38.1% | 20 -13.0% | 219 +321.2% |
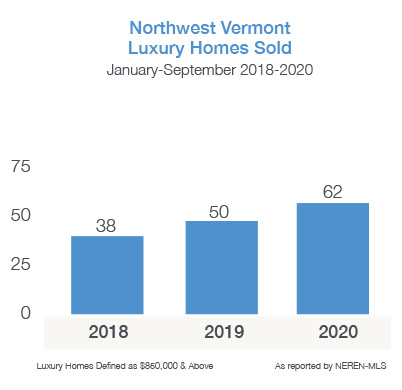
| Luxury Homes September-June 2020 | |||
|---|---|---|---|
| Median Sale Price: | Units Sold: | Newly Listed | Days on Market: |
| $1,107,500 +12.8% | 62 +24% | 126 +35.5% | 140 -4.8% |
| Address | Town | County | Sale Price | Sale Date |
|---|---|---|---|---|
| 163 Old Stage Lane | Shelburne | Chittenden | $850,000 | 7/2/2020 |
| 8 Whately Road | South Burlington | Chittenden | $860,000 | 7/31/2020 |
| 3323 Highbridge Road | Georgia | Franklin | $875,000 | 9/2/2020 |
| 587 Ridgefield Road | Shelburne | Chittenden | $875,000 | 1/21/2020 |
| 6659 Spear Street | Charlotte | Chittenden | $880,000 | 6/29/2020 |
| 177 Maeck Farm Road | Shelburne | Chittenden | $882,500 | 8/6/2020 |
| 193 Poor Farm Road | Colchester | Chittenden | $885,000 | 2/28/2020 |
| 2751 Thompson's Point Road | Charlotte | Chittenden | $885,000 | 6/16/2020 |
| 208 Meadowood Drive | South Burlington | Chittenden | $887,500 | 3/27/2020 |
| 2687 Greenbush Road | Charlotte | Chittenden | $890,000 | 6/15/2020 |
| 2296 Greenbush Road | Charlotte | Chittenden | $918,500 | 9/15/2020 |
| 51 Bixby Hill Road | Essex | Chittenden | $925,000 | 7/15/2020 |
| 296 South Cove Road | Burlington | Chittenden | $925,000 | 8/13/2020 |
| 162 Autumn Hill Lane | Shelburne | Chittenden | $950,000 | 8/19/2020 |
| 330 Cold Spring Road | Milton | Chittenden | $959,900 | 9/17/2020 |
| 1275 Spear Street | South Burlington | Chittenden | $965,000 | 9/10/2020 |
| 1301 Cider Mill Road | Cornwall | Addison | $995,000 | 9/16/2020 |
| 38 Contentment Lane | South Hero | Grand Isle | $1,000,000 | 7/31/2020 |
| 615 Thayer Beach Road | Colchester | Chittenden | $1,005,000 | 8/24/2020 |
| 119 Holmes Road | South Burlington | Chittenden | $1,020,000 | 6/9/2020 |
| 211 Mills Road | Georgia | Franklin | $1,025,000 | 9/4/2020 |
| 263 Quarry Road | Shelburne | Chittenden | $1,050,000 | 8/18/2020 |
| 1816 Morgan Horse Farm Road | Weybridge | Addison | $1,070,000 | 3/2/2020 |
| 3408 Harbor Road | Shelburne | Chittenden | $1,145,000 | 7/29/2020 |
| 266 South Union Street | Burlington | Chittenden | $1,149,000 | 8/5/2020 |
| 293 Ordway Shore Road | Shelburne | Chittenden | $1,150,000 | 9/1/2020 |
| 837 Bay Road | Shelburne | Chittenden | $1,150,000 | 6/8/2020 |
| 209 Hills Point Road | Charlotte | Chittenden | $1,165,000 | 1/20/2020 |
| 219 Appletree Point Road | Burlington | Chittenden | $1,200,000 | 8/25/2020 |
| 465 Autumn Hill Lane | Shelburne | Chittenden | $1,200,000 | 9/21/2020 |
| 719 Converse Bay Road | Charlotte | Chittenden | $1,200,000 | 8/10/2020 |
| 51 Van Sicklen Road | South Burlington | Chittenden | $1,200,000 | 7/2/2020 |
| 347 Popple Dungeon Road | Charlotte | Chittenden | $1,239,000 | 4/1/2020 |
| 50 Windridge Road | South Hero | Grand Isle | $1,250,000 | 7/7/2020 |
| 14 Turtle Bay Lane | South Hero | Grand Isle | $1,250,000 | 9/14/2020 |
| 222 McNeil Cove Road | Charlotte | Chittenden | $1,265,000 | 8/19/2020 |
| 104 Pine Haven Shores Lane | Shelburne | Chittenden | $1,295,000 | 8/21/2020 |
| 301 Wolfe Road | Addison | Addison | $1,310,000 | 7/27/2020 |
| 64 Waterview Road | Colchester | Chittenden | $1,350,000 | 7/8/2020 |
| 475 Golf Course Road | South Burlington | Chittenden | $1,370,000 | 7/27/2020 |
| 27 Lakeview Terrace | Burlington | Chittenden | $1,375,000 | 9/30/2020 |
| 2854 Harbor Road | Shelburne | Chittenden | $1,425,000 | 7/9/2020 |
| 99 Central Avenue | South Burlington | Chittenden | $1,450,000 | 8/31/2020 |
| 121 West Shore Road | Grand Isle | Grand Isle | $1,460,000 | 9/25/2020 |
| 7133 Spear Street | Charlotte | Chittenden | $1,531,884 | 8/31/2020 |
| 269 Thorpe Cove Road | Charlotte | Chittenden | $1,550,000 | 1/31/2020 |
| 233 Thorpe Cove Road | Charlotte | Chittenden | $1,630,000 | 6/29/2020 |
| 386 South Forty Road | Shelburne | Chittenden | $1,650,000 | 8/17/2020 |
| 116 Sunset Cliff | Burlington | Chittenden | $1,950,000 | 9/25/2020 |
| 324 Wings Point | Charlotte | Chittenden | $1,950,000 | 8/31/2020 |
| 33 Colodny Way | South Hero | Grand Isle | $2,050,000 | 8/12/2020 |
| 164 Pheasant Hill Ridge Road | Shelburne | Chittenden | $2,135,000 | 6/26/2020 |
| 341 West Shore Road | South Hero | Grand Isle | $2,150,000 | 9/3/2020 |
| 3735 Harbor Road | Shelburne | Chittenden | $4,950,000 | 1/17/2020 |
| MEDIAN SALE PRICE | VS 2019 | UNITS SOLD | VS 2019 | NEWLY LISTED | VS 2019 | DAYS ON MARKET | |
|---|---|---|---|---|---|---|---|
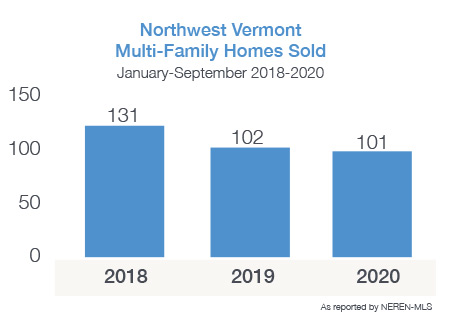
| All Counties Multi-Family | $327,500 | 2.3% | 101 | -1.0% | 164 | -14.1% | 118 |
| Chittenden County | $425,000 | 9.0% | 61 | -9.0% | 102 | -14.3% | 76 |
| Addison County | $219,100 | -5.8% | 11 | 450.0% | 16 | -5.9% | 275 |
| Franklin County | $213,750 | 18.3% | 28 | -15.2% | 43 | -15.7% | 136 |
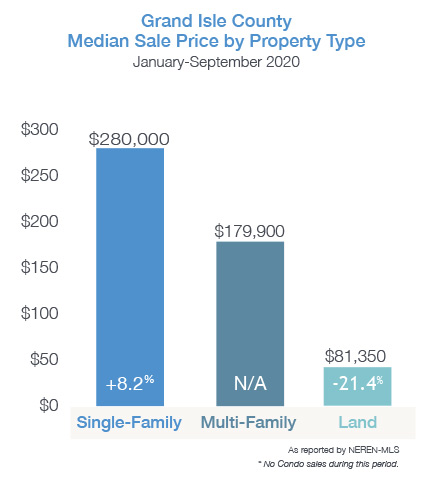
| Grand Isle County | $179,900 | n/a | 1 | n/a | 3 | -25.0% | 475 |

| MEDIAN SALE PRICE | VS 2019 | UNITS SOLD | VS 2019 | NEWLY LISTED | VS 2019 | DAYS ON MARKET | |
|---|---|---|---|---|---|---|---|
| All Counties Multi-Family | $99,500 | -0.3% | 158 | 6.8% | 403 | 5.8% | 317 |
| Chittenden County | $160,000 | 22.3% | 53 | -11.7% | 104 | -7.1% | 218 |
| Addison County | $82,000 | 21.5% | 50 | 28.2% | 104 | 28.4% | 431 |
| Franklin County | $53,500 | -28.9% | 39 | 30.0% | 121 | -10.4% | 280 |
| Grand Isle County | $81,350 | -21.4% | 16 | -15.8% | 74 | 39.6% | 375 |
Summer is in full swing with high temperatures not felt since 2018. As the weather heated up, so did the real estate market after a short pause due to the Coronavirus. As the pandemic spread, Vermont Governor, Phil Scott, issued a “Stay At Home” order in late March. Real estate sales were on hold except for contracts already in the pipeline and ready to close. As the spigot was slowly turned back on, real estate showings resumed on April 20th with restrictions lifting weekly. The most recent change is flexibility in quarantining for out-of-state buyers – who were largely shut out of the Vermont market since March.
| Single Family January-June | ||||
|---|---|---|---|---|
| Median Sale Price: | Average Sale Price: | Units Sold: | Newly Listed: | Days on Market: |
| $306,500 +1.2% | $343,202 -0.3% | 878 -13.3% | 1380 -21.1% | 91 +12.4% |
| Condo January-June | ||||
|---|---|---|---|---|
| Median Sale Price: | Average Sale Price: | Units Sold: | Newly Listed: | Days on Market: |
| $249,900 +4.1% | $279,854 +4.1% | 300 -9.9% | 401 -5.0% | 59 -25.3% |
| Single Family April-June | ||||
|---|---|---|---|---|
| Median Sale Price: | Average Sale Price: | Units Sold: | Newly Listed: | Days on Market: |
| $316,700 0% | $347,860 -1.9% | 500 -24.2% | 848 -26% | 85 +11.8% |
| Condo April-June | ||||
|---|---|---|---|---|
| Median Sale Price: | Average Sale Price: | Units Sold: | Newly Listed: | Days on Market: |
| $249,000 +0.6% | $276,673 +0.5% | 153 -30.1% | 217 -19% | 49 -38.8% |
The height of the real estate market is typically in the spring, leading to closings in late spring and early summer. Therefore, we are providing additional data in this mid-year report. Typically, our report would present the statistics from January 1st – June 30th. However, we are including data from the 2nd quarter as well (April 1st- June 30th) to demonstrate the effect that the shutdown had on a market which started quite strong in 2020.
The pandemic has had a massive effect on the economy, but the housing market has not taken a major dive, unlike the Great Recession of 2008, which was largely driven by the housing sector. As sharp and quick as the decline in the market was – the recovery has been nearly as strong. Pent up demand of buyers ready for the spring market – wanting to benefit from historically low mortgage interest rates (briefly falling below 3% for the first time in 50 years)- has resulted in multiple offers on homes within days of hitting the market. Many homes are selling for well above list price – causing lenders, appraisers, buyers, sellers and even real estate agents to wonder where the “top” of the market will be. A real estate purchase or sale should be contemplated based upon your own needs and financial objectives. Attempting to “time” the market is simply impossible and will result in frustration and missed opportunities.
 Other indications of strong demand include online search activity. Search traffic to HickokandBoardman.com remained strong, throughout the pandemic, with over 200,000 visits for property in Chittenden, Addison, Franklin, and Grand Isle Counties. Out-of-state traffic, perhaps driven by the desire to relocate to a more rural market, accounts for roughly 45% of overall traffic. We are seeing a significant increase in web traffic from prospective out-of-state buyers from Massachusetts, Florida, Virginia, New Jersey, and California.
Some Economists, nationally, caution that prices may fall later this year as the effects of unemployment and foreclosures weigh down the market. Homeowners, who opted to postpone mortgage and loan payments during the peak of the pandemic, are now receiving notices that their deferred payments are due. Locally, supply & demand may sustain price growth. Our area is not oversupplied, and the pipeline of new, affordably priced homes coming on the market is not enough to satisfy buyers. An experienced Chittenden County appraiser reported that he is factoring in an appreciation of 4-4.5% when calculating the market value of purchase and refinanced properties.
As we have reported for the past two years, a lack of inventory in homes for sale remains a challenge; decreasing over the past three months as sellers were hesitant to allow buyers inside. Seller confidence should improve as Vermont ranks top in the nation for management of the virus. With years of price growth in northwest Vermont and scheduled showings of well- qualified buyers rising dramatically (according to ShowingTime) – sellers can reap the benefits of their strong equity position. Getting on the market now is important to balance the real estate market.
Hunkering down in our homes has caused us to reflect on what we need for comfort and safety. Do we need a home office, more space for family, less indoor space and more outdoor living space? No doubt these discoveries will shape the direction of buyers, sellers and homeowners going forward. It has been reported that home improvement purchases have spiked during this pandemic – as many have the time and attention to devote to enhancements to living spaces. Never more than now, do we appreciate what home means to all of us.
Our mid-year report includes data for the first 6 months of 2020, as well as data for the 2nd quarter of 2020 alone. We cannot analyze the trends in the northwest Vermont real estate market without understanding the effects of COVID-19 which struck Vermont in mid-March.
| Single Family January-June | ||||
|---|---|---|---|---|
| Median Sale Price: | Average Sale Price: | Units Sold: | Newly Listed: | Days on Market: |
| $360,000 +1.4% | $420,483 +2.8% | 467 -18.8% | 715 -22.1% | 56 0% |
| Condo January-June | ||||
|---|---|---|---|---|
| Median Sale Price: | Average Sale Price: | Units Sold: | Newly Listed: | Days on Market: |
| $261,100 +6.6% | $286,077 +4.0% | 272 -9.6% | 353 -1.9% | 55 -27.6% |
| Single Family April-June | ||||
|---|---|---|---|---|
| Median Sale Price: | Average Sale Price: | Units Sold: | Newly Listed: | Days on Market: |
| $376,000 +3.0% | $427,373 +2.2% | 257 -32% | 437 -26.1% | 42 -20.8% |
| Condo April-June | ||||
|---|---|---|---|---|
| Median Sale Price: | Average Sale Price: | Units Sold: | Newly Listed: | Days on Market: |
| $249,000 +0.6% | $276,673 +0.5% | 153 -30.1% | 217 -19% | 49 -38.8% |
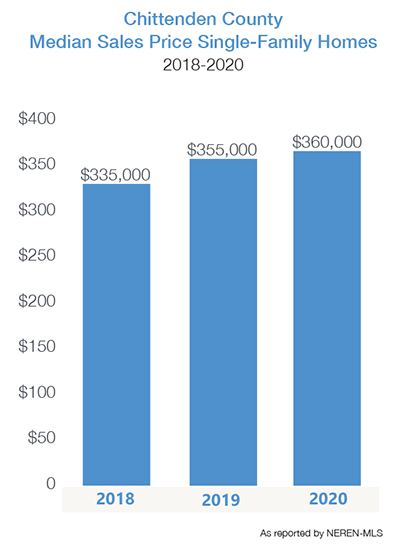
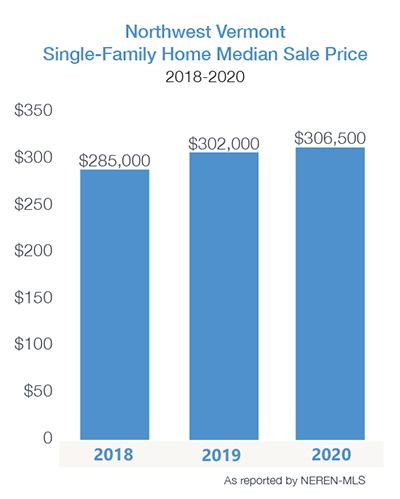
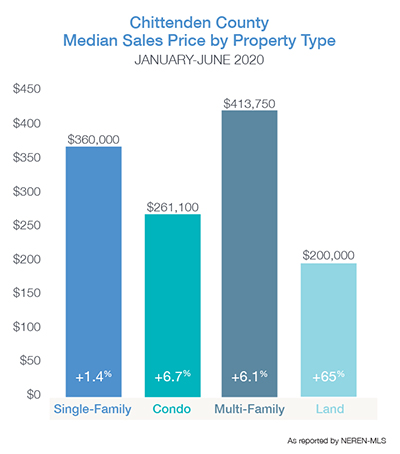
The median sale price for single-family homes continued the year over year climb to $360,000; a 7.5% increase over the same period in 2018. Condominium pricing also rose while still providing a more affordable and low maintenance option for home buyers. Newly listed homes dropped 26% during the second quarter amidst the spread of COVID-19 – increasing the pressure on an already undersupplied market. Sellers, hesitant to open their homes to in-person showings yet motivated to keep their home listed for sale, worked with our marketing team to create video tours of their property.
 Buyers acted quickly when the right property caught their eye resulting in only 42 days on the market (DOM) – the number of days from list to contract; the lowest we’ve seen in many years. In some key price points and locations, the “DOM” is in the single digits.
| MEDIAN SALE PRICE | VS 2019 | UNITS SOLD | VS 2019 | NEWLY LISTED | VS 2019 | DAYS ON MARKET | |
|---|---|---|---|---|---|---|---|
| Chittenden County Single-Family | $360,000 | 1.40% | 467 | -18.80% | 715 | -22.10% | 56 |
| Bolton | $282,500 | 12.80% | 2 | 0.00% | 6 | 20% | 42 |
| Buels Gore | n/a | n/a | n/a | n/a | n/a | n/a | n/a |
| Burlington | $347,000 | -8.20% | 65 | -30.10% | 93 | -32.10% | 44 |
| Charlotte | $522,000 | 11.10% | 21 | -22.20% | 40 | -29.80% | 104 |
| Colchester | $363,500 | 2.80% | 67 | -1.50% | 89 | -26.50% | 50 |
| Essex | $339,950 | 3.30% | 70 | -21.40% | 102 | -20.30% | 40 |
| Hinesburg | $349,000 | 22.30% | 12 | -40.00% | 19 | -32.10% | 64 |
| Huntington | $325,500 | -6.80% | 7 | -36.40% | 11 | -15.40% | 146 |
| Jericho | $385,000 | -4.40% | 12 | -63.60% | 29 | -35.60% | 78 |
| Milton | $289,950 | 6.60% | 40 | -4.80% | 56 | -22.20% | 37 |
| Richmond | $350,000 | 15.70% | 13 | 18.20% | 18 | -21.70% | 122 |
| Shelburne | $597,500 | 21.60% | 19 | -47.20% | 36 | -28.00% | 88 |
| South Burlington | $430,000 | 6.40% | 64 | -7.30% | 105 | -6.30% | 55 |
| St. George | $434,393 | 13.70% | 9 | 350% | 10 | 25.00% | 41 |
| Underhill | $326,500 | 20.60% | 9 | 28.60% | 21 | -19.20% | 66 |
| Westford | $314,900 | 14.50% | 13 | -7.10% | 18 | 0.00% | 75 |
| Williston | $397,000 | -17.00% | 28 | -9.70% | 46 | -4.20% | 38 |
| Winooski | $266,750 | 15.50% | 16 | -20% | 16 | -40.70% | 46 |
| MEDIAN SALE PRICE | VS 2019 | UNITS SOLD | VS 2019 | NEWLY LISTED | VS 2019 | DAYS ON MARKET | |
|---|---|---|---|---|---|---|---|
| Chittenden County Condo | $261,100 | 6.70% | 272 | -9.60% | 353 | -1.90% | 55 |
| Bolton | $126,500 | -1.30% | 8 | 0.00% | 10 | 67% | 48 |
| Burlington | $317,500 | 9.10% | 39 | -2.50% | 55 | -12.70% | 35 |
| Colchester | $246,000 | 12.20% | 37 | -7.50% | 43 | 4.90% | 98 |
| Essex | $214,500 | -10.40% | 48 | -23.80% | 61 | -10.30% | 76 |
| Hinesburg | $286,500 | 5.40% | 1 | -66.70% | n/a | n/a | 163 |
| Jericho | $430,316 | 130.20% | 5 | 66.70% | 6 | -25.00% | 32 |
| Milton | $241,000 | 3.90% | 13 | 18.20% | 17 | 41.70% | 46 |
| Richmond | n/a | n/a | n/a | n/a | n/a | n/a | n/a |
| Shelburne | $475,000 | 15.30% | 13 | 18.20% | 15 | -11.80% | 66 |
| South Burlington | $249,000 | 8.30% | 77 | -9.40% | 101 | -5.60% | 44 |
| Williston | $302,450 | -7.40% | 20 | -28.60% | 28 | -3.50% | 20 |
| Winooski | $260,000 | 4.00% | 11 | 37.50% | 17 | 142.90% | 23 |
Our mid-year report includes data for the first 6 months of 2020, as well as data for the 2nd quarter of 2020 alone. We cannot analyze the trends in the northwest Vermont real estate market without understanding the effects of COVID-19 which struck Vermont in mid-March.
| Single Family January-June | ||||
|---|---|---|---|---|
| Median Sale Price: | Average Sale Price: | Units Sold: | Newly Listed: | Days on Market: |
| $260,000 +2.7% | $273,505 -4.7% | 127 -16.5% | 210 -27.8% | 147 +26.7% |
| Condo January-June | ||||
|---|---|---|---|---|
| Median Sale Price: | Average Sale Price: | Units Sold: | Newly Listed: | Days on Market: |
| $229,900 +3.3% | $231,967 +2.2% | 3 -70% | 7 -56.3% | 25 -60.3% |
| Single Family April-June | ||||
|---|---|---|---|---|
| Median Sale Price: | Average Sale Price: | Units Sold: | Newly Listed: | Days on Market: |
| $275,000 +5.8% | $287,375 -4.8% | 75 -21.1% | 133 -33.5% | 133 +22% |
| Condo April-June | ||||
|---|---|---|---|---|
| Median Sale Price: | Average Sale Price: | Units Sold: | Newly Listed: | Days on Market: |
| $233,000 -5.9% | $233,000 -11.1% | 2 -71.4% | 3 -72.7% | 28 -54.8% |
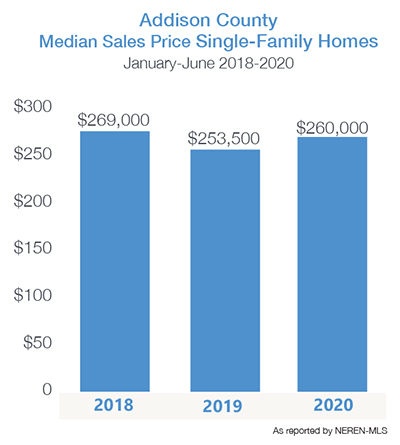
Buyers are attracted to the more rural feel and affordable home prices in Addison County. While the median price of single-family homes jumped to $275,000 during the 2nd quarter, the median price has been fairly stable since 2018. Middlebury, Vergennes, Bristol and Ferrisburgh topped the list for the number of closed sales so far in 2020.
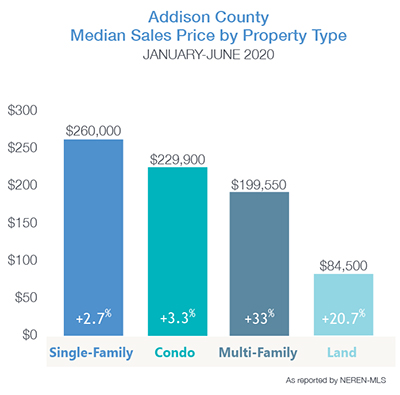 As travel restrictions for out of state buyers loosen, sales of homes, including lakefront property in Addison County, should recover. Historically, the area accounts for 12-15% of the luxury home sales in northwest Vermont.
| MEDIAN SALE PRICE | VS 2019 | UNITS SOLD | VS 2019 | NEWLY LISTED | VS 2019 | DAYS ON MARKET | |
|---|---|---|---|---|---|---|---|
| Addison County Single-Family | $260,000 | 2.70% | 127 | -16.50% | 210 | -27.80% | 147 |
| Addison | $289,000 | 9.10% | 7 | -22.20% | 11 | -48% | 130 |
| Bridport | $80,000 | -68.90% | 3 | -40.00% | 7 | -30.00% | 300 |
| Bristol | $225,000 | -17.40% | 13 | -13.30% | 27 | 17.40% | 104 |
| Cornwall | $310,000 | -21.10% | 3 | 0.00% | 10 | 66.70% | 104 |
| Ferrisburgh | $224,500 | 9.50% | 12 | -36.80% | 30 | 7.10% | 182 |
| Goshen | $270,000 | 160.30% | 1 | -66.70% | n/a | n/a | 172 |
| Granville | n/a | n/a | n/a | n/a | 3 | -25.00% | |
| Hancock | $100,000 | -58.30% | 1 | 0.00% | 4 | -20.00% | 27 |
| Leicester | $95,500 | -50.70% | 6 | 50.00% | 5 | -50.00% | 177 |
| Lincoln | $133,000 | -30.60% | 3 | -50.00% | 6 | -53.90% | 173 |
| Middlebury | $285,500 | 5.70% | 24 | -20.00% | 33 | -37.70% | 146 |
| Monkton | $335,000 | 37.40% | 7 | -12.50% | 16 | 14.30% | 53 |
| New Haven | $219,000 | -35.60% | 3 | 0.00% | 9 | 12.50% | 149 |
| Orwell | $225,000 | 76.10% | 5 | 25% | 5 | -64.30% | 185 |
| Panton | $220,000 | -61.80% | 3 | -57.10% | 2 | -77.80% | 94 |
| Ripton | $40,000 | -80.00% | 1 | -80.00% | 5 | 25.00% | 61 |
| Salisbury | $255,000 | -27.10% | 5 | 66.70% | 4 | -63.60% | 111 |
| Shoreham | $342,500 | 42.70% | 4 | -33% | 6 | -62.50% | 446 |
| Starksboro | $370,000 | 51.00% | 5 | 0.00% | 11 | 37.50% | 110 |
| Vergennes | $271,000 | 23.20% | 13 | 44.40% | 11 | -54.20% | 102 |
| Waltham | $279,000 | 100.70% | 3 | 0.00% | 1 | -66.70% | 101 |
| Weybridge | $271,000 | -66.10% | 4 | 33.30% | 3 | -25.00% | 275 |
| Whiting | $118,000 | n/a | 1 | n/a | 1 | n/a | 15 |
Our mid-year report includes data for the first 6 months of 2020, as well as data for the 2nd quarter of 2020 alone. We cannot analyze the trends in the northwest Vermont real estate market without understanding the effects of COVID-19 which struck Vermont in mid-March.
| Single Family January-June | ||||
|---|---|---|---|---|
| Median Sale Price: | Average Sale Price: | Units Sold: | Newly Listed: | Days on Market: |
| $245,500 +9.1% | $244,681 +6.3 | 241 +6.2% | 357 -12.3% | 117 +14.7% |
| Condo January-June | ||||
|---|---|---|---|---|
| Median Sale Price: | Average Sale Price: | Units Sold: | Newly Listed: | Days on Market: |
| $210,000 +11.1% | $217,892 +9.6% | 25 +19.1% | 41 -8.9% | 112 -16.4% |
| Single Family April-June | ||||
|---|---|---|---|---|
| Median Sale Price: | Average Sale Price: | Units Sold: | Newly Listed: | Days on Market: |
| $257,000 +10.4% | $251,980 +6.4% | 145 -2.7% | 218 -14.8% | 117 +25.8% |
| Condo April-June | ||||
|---|---|---|---|---|
| Median Sale Price: | Average Sale Price: | Units Sold: | Newly Listed: | Days on Market: |
| $243,250 +26.4% | $240,075 +20.8% | 14 -6.7% | 23 -37.8% | 104 -35.4% |
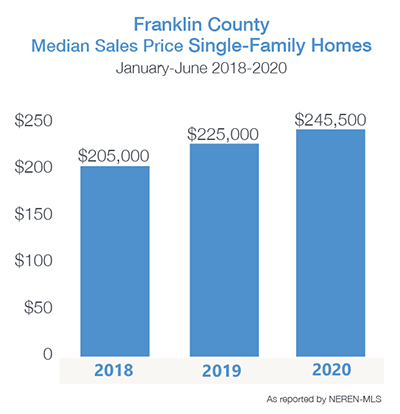
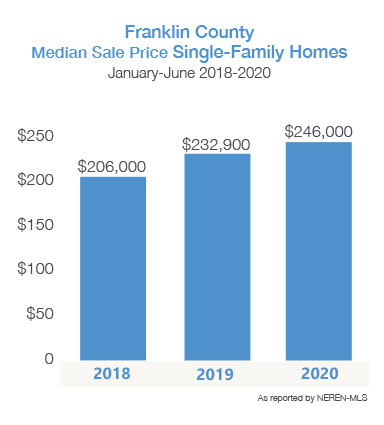
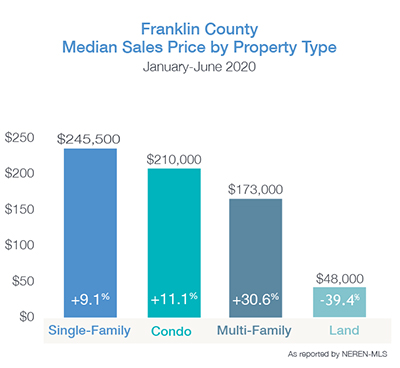
Franklin County fared well during the first half of 2020 despite the limitations caused by COVID-19. The affordability of homes and convenient location near I-89 make the county an excellent option for buyers. The number of units sold increased for single-family homes and condos during the period. This is likely a result of the availability of inventory and a median price $115k less than nearby Chittenden County.
The median price of single-family homes in Franklin County has increased by nearly 20% since 2018, but remains an affordable option for buyers and is good news for sellers who have increased equity in their home.
St. Albans and Swanton represent 42% of the sales closed in Franklin County, while Montgomery tops the county in median sale price at $310,000.
| MEDIAN SALE PRICE | VS 2019 | UNITS SOLD | VS 2019 | NEWLY LISTED | VS 2019 | DAYS ON MARKET | |
|---|---|---|---|---|---|---|---|
| Franklin County Single-Family | $245,500 | 9.10% | 241 | 6.20% | 357 | -12% | 117 |
| Bakersfield | $249,950 | 2.00% | 8 | 60.00% | 9 | -18.20% | 169 |
| Berkshire | $155,000 | -13.20% | 3 | -25.00% | 6 | -33.30% | 167 |
| Enosburg | $208,000 | 5.10% | 15 | 36.40% | 16 | -20.00% | 152 |
| Fairfax | $300,000 | -2.00% | 23 | -4.20% | 41 | 7.90% | 64 |
| Fairfield | $263,000 | -10.20% | 7 | 0.00% | 8 | -20.00% | 102 |
| Fletcher | $275,000 | 4.60% | 9 | 0.00% | 5 | -68.80% | 244 |
| Franklin | $310,500 | 98.70% | 8 | 166.70% | 9 | -40.00% | 211 |
| Georgia | $283,500 | -5.90% | 24 | 0.00% | 34 | 3.00% | 127 |
| Highgate | $218,000 | 3.80% | 21 | 162.50% | 32 | 33.30% | 65 |
| Montgomery | $310,000 | 108.10% | 5 | 0.00% | 16 | 6.70% | 120 |
| Richford | $111,450 | 19.50% | 10 | -28.60% | 16 | -40.70% | 254 |
| Sheldon | $234,950 | 48.70% | 6 | -25.00% | 13 | -43.50% | 66 |
| St. Albans | $244,500 | 11.50% | 61 | -13% | 99 | 2.10% | 86 |
| Swanton | $235,000 | 4.40% | 41 | 17.10% | 53 | -23.20% | 115 |