Chittenden County Market Results

131 Main Street, Burlington, VT ~ Renovated from a former law office by an award-winning builder & architect. 1st floor flat with 10’ ceilings & expansive living space.
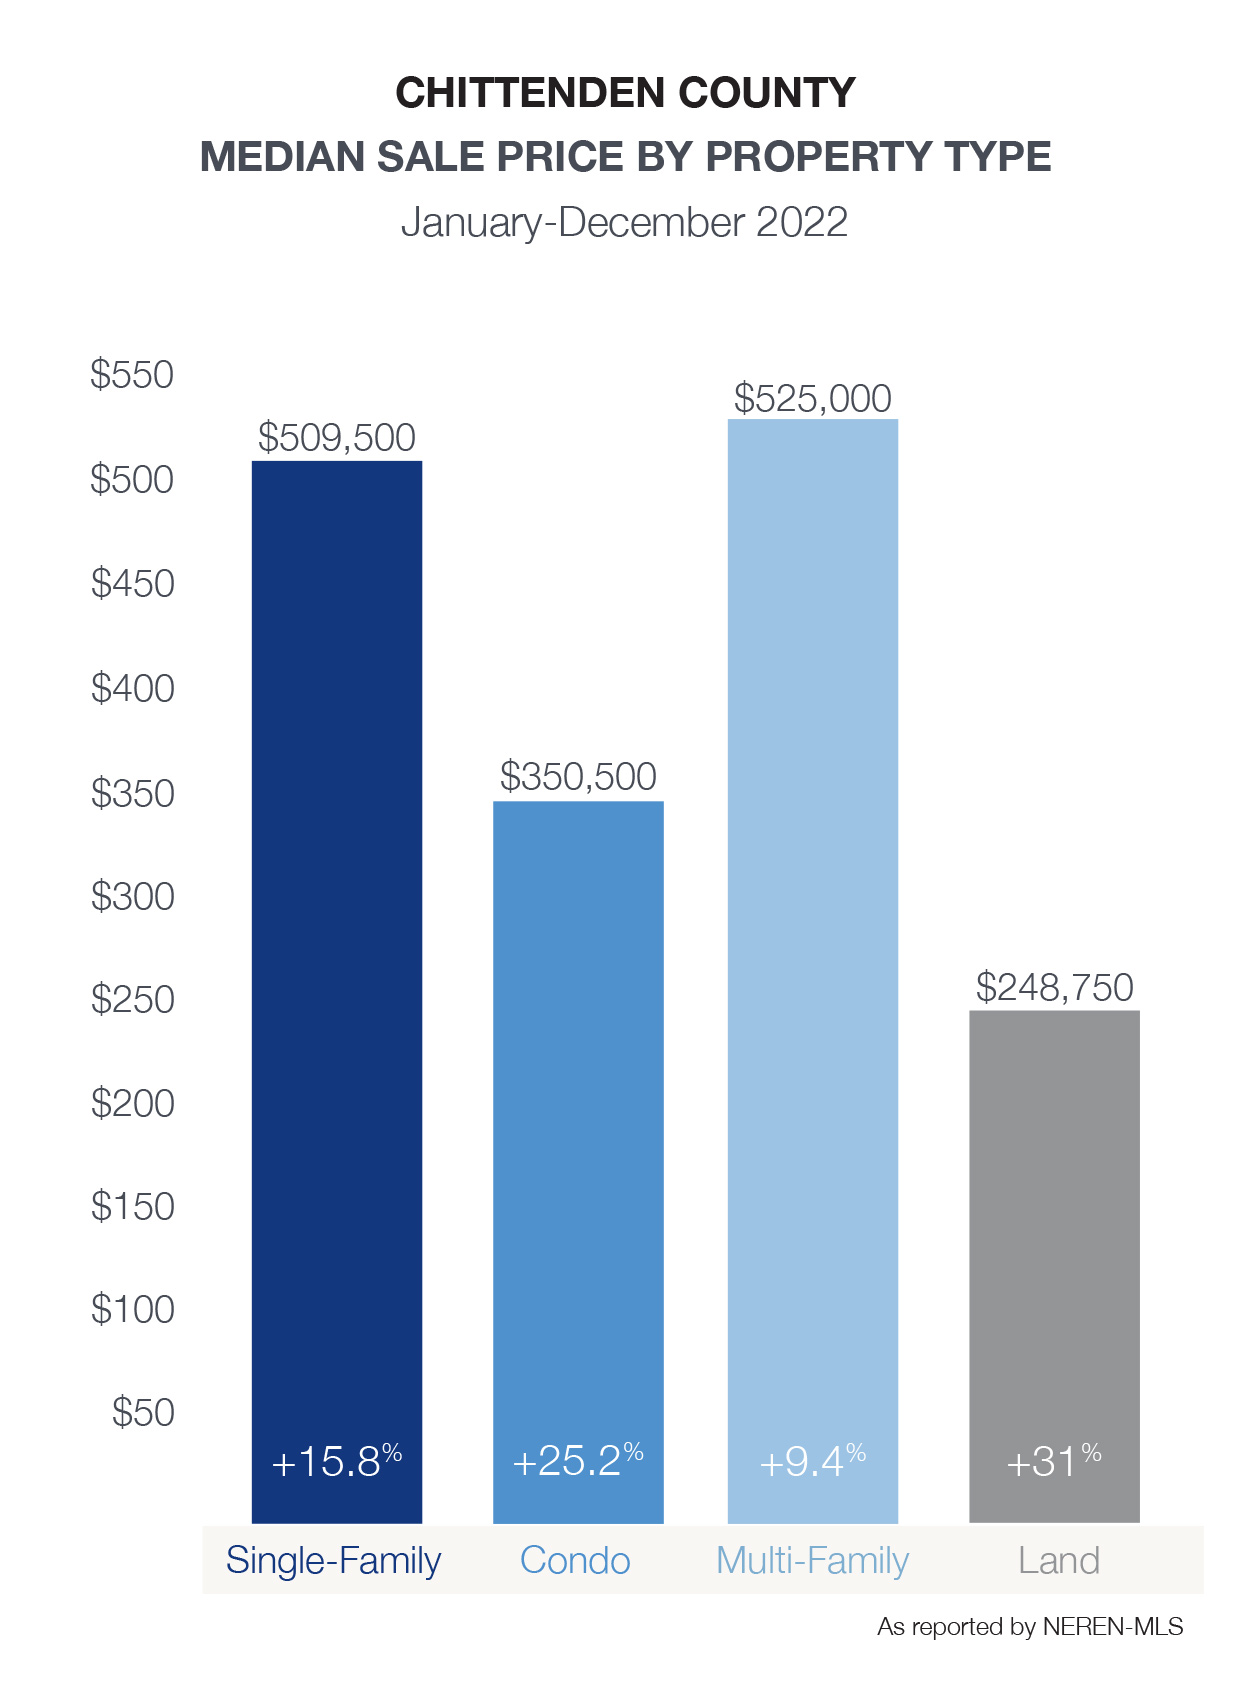
Single-Family January-December 2022
Median Sale Price:Average Sale Price:Units Sold:Newly Listed:Days on Market:
$509,500 +15.8% $592,113 +14.1%
1,130 -19.6%
1,253 -17%
19 -24%
Condo January-December 2022
Median Sale Price:Average Sale Price:Units Sold:Newly Listed:Days on Market:
$350,500 +25.2% $390,289 +20.7%
642 -3.8%
642 -7.2%
20 -31%

The demand for homes in Chittenden County remained strong throughout 2022, with a slight slow down during the second half of the year. With limited inventory – a decline of 17% for single family homes and 7% for condos – median sale prices rose substantially.

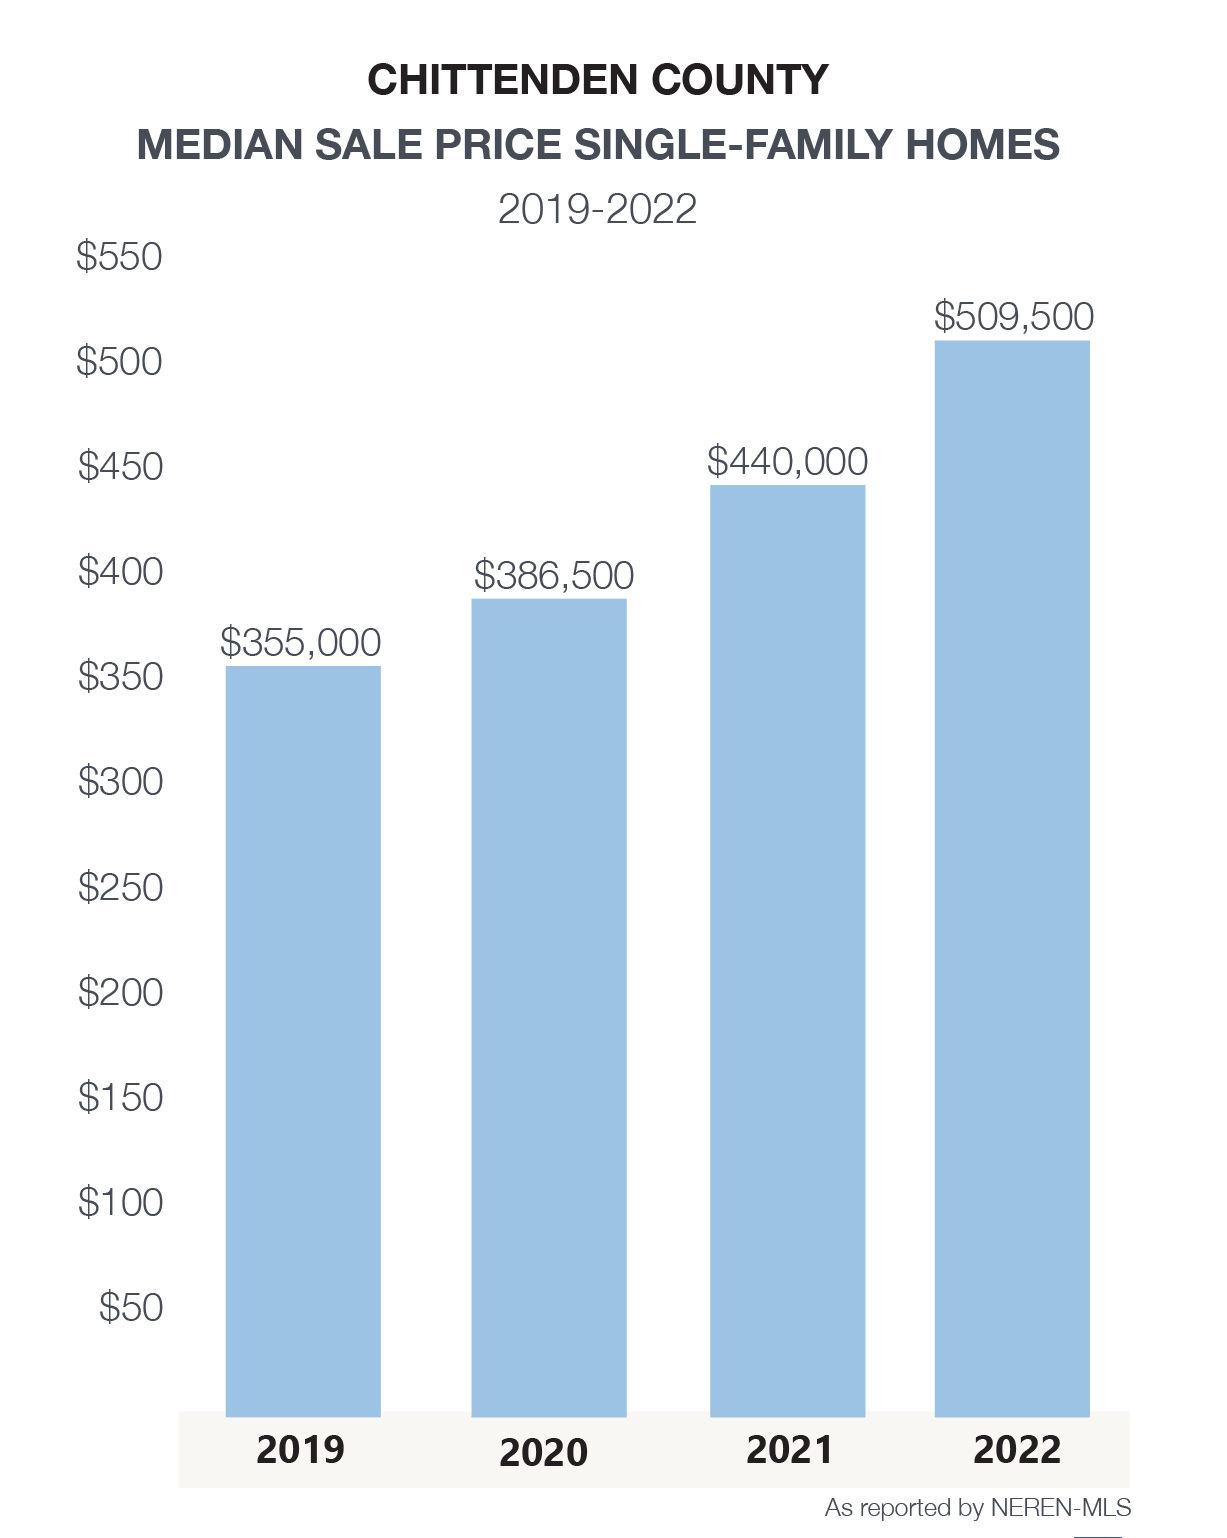
Less units sold in 2022 is not a reflection of the number of buyers participating in the market. Many purchasers faced multiple offers, needing to exercise patience while working closely with their REALTOR to close on a home that met their needs. The median sale price of a single-family home has risen 43% since 2019. Homeowners have built equity, while keeping the largest portion of their living expenses – their mortgage – stable. For this reason, buyers should remain in the market. The opportunity to build wealth, manage your housing expenses, and enjoy the many benefits of homeownership simply do not exist as a renter.

MEDIAN SALE PRICEVS 2021UNITS SOLDVS 2021NEWLY LISTEDVS 2021DAYS ON MARKET
Chittenden County Single-Family
$509,500 15.80%1,130-19.60%1,253-17.00%19
Bolton
$606,000 66.10%4-33.30%5-28.60%22
Burlington
$519,900 15.30%191-9.50%229-1.30%15
Charlotte
$700,000 7.70%412.50%38-17.40%37
Colchester
$484,500 8.70%110-29.50%122-29.10%28
Essex
$450,000 12.50%181-10.80%187-18.00%15
Hinesburg
$485,000 10.90%43-6.50%479.30%17
Huntington
$334,750 -13.50%2229.40%239.50%28
Jericho
$490,000 -2.00%35-39.70%34-45.20%23
Milton
$416,500 18.00%78-39.50%92-31.90%20
Richmond
$498,500 -5.50%24-14.30%25-28.60%8
Shelburne
$765,000 11.70%85-14.10%96-5.00%21
South Burlington
$605,000 16.40%139-29.40%147-24.20%19
St. George
$401,850 -27.30%4-63.60%8-11.10%6
Underhill
$486,500 9.30%23-17.90%27-10.00%18
Westford
$423,000 3.60%16-38.50%19-20.80%22
Williston
$602,500 9.60%1006.40%12315.00%17
Winooski
$362,950 5.20%34-40.40%31-51.60%8
MEDIAN SALE PRICEVS 2021UNITS SOLDVS 2021NEWLY LISTEDVS 2021DAYS ON MARKET
Chittenden County Condo$350,500 25.20%642-3.80%642-7.20%20
Bolton
$258,600 30.60%10-16.70%110.00%5
Burlington
$400,000 32.90%13324.30%14336.20%13
Charlotte
$370,000 -14.90%1-75.00%1-75.00%25
Colchester
$330,000 24.50%70-9.10%64-21.00%31
Essex
$340,000 36.40%107-23.60%100-22.50%12
Hinesburg$401,250 44.90%10-16.70%1122.20%9
Jericho$291,500 -3.80%2-80.00%1-90.00%5
Milton$273,000 10.40%15-25.00%249.10%28
Richmond$340,000 14.70%20.00%2100.00%7
Shelburne$430,000 48.80%23-8.00%21-34.40%27
South Burlington$330,000 17.00%1952.10%189-11.70%26
Williston$415,000 18.20%5928.30%6020.00%9
Winooski$361,000 18.40%15-28.60%15-37.50%40