| Single-Family January-December 2022 | ||||
|---|---|---|---|---|
| Median Sale Price: | Average Sale Price: | Units Sold: | Newly Listed: | Days on Market: |
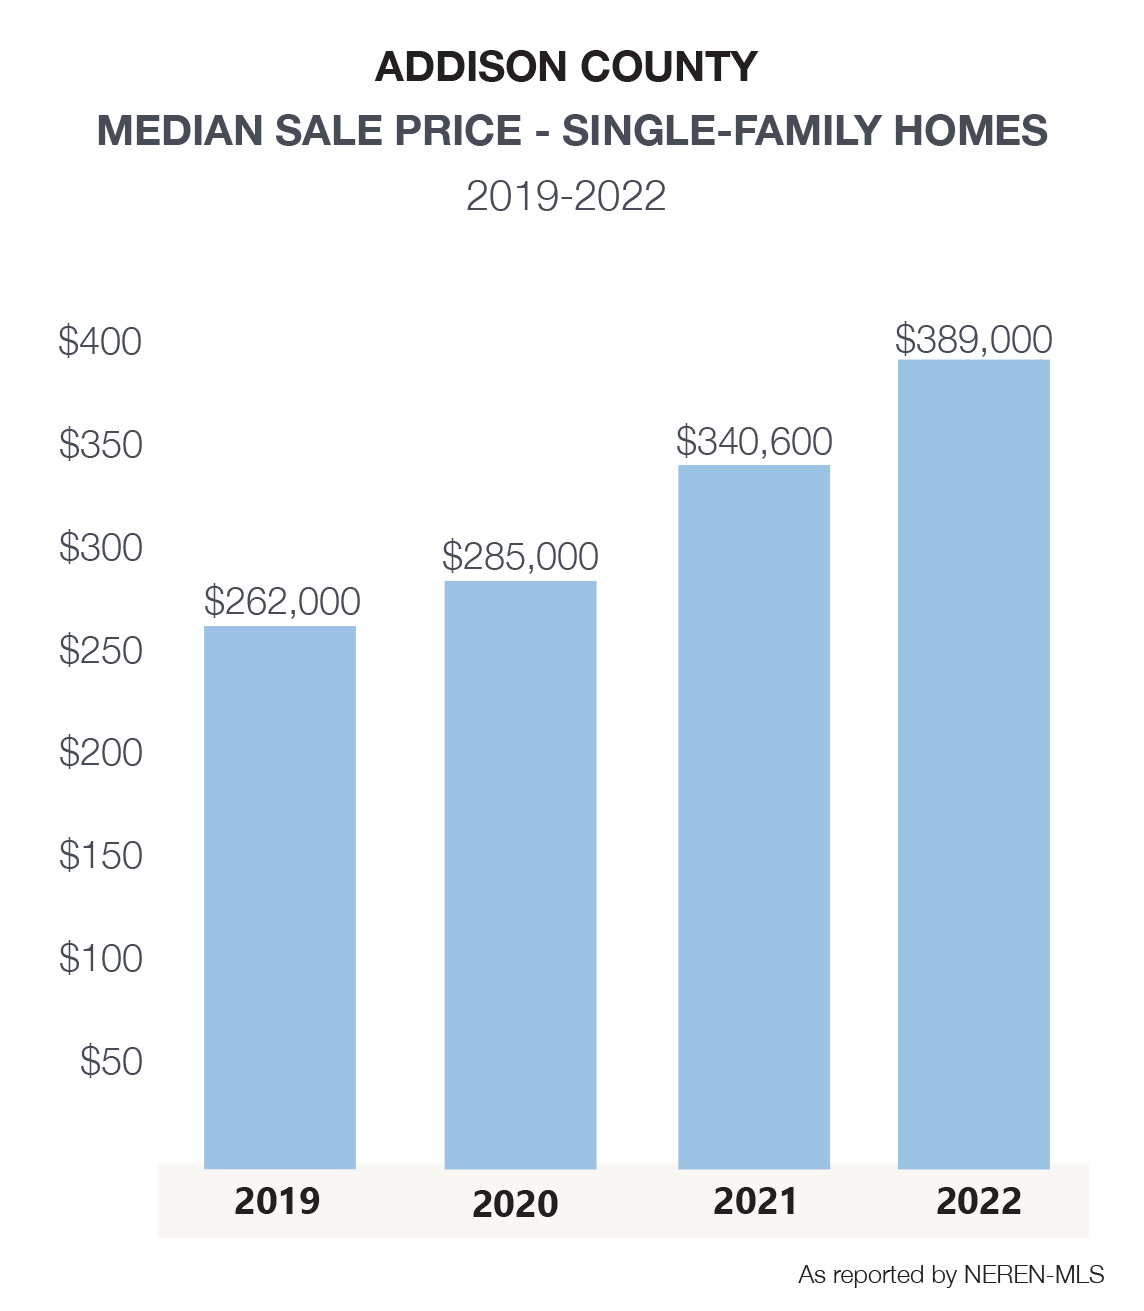
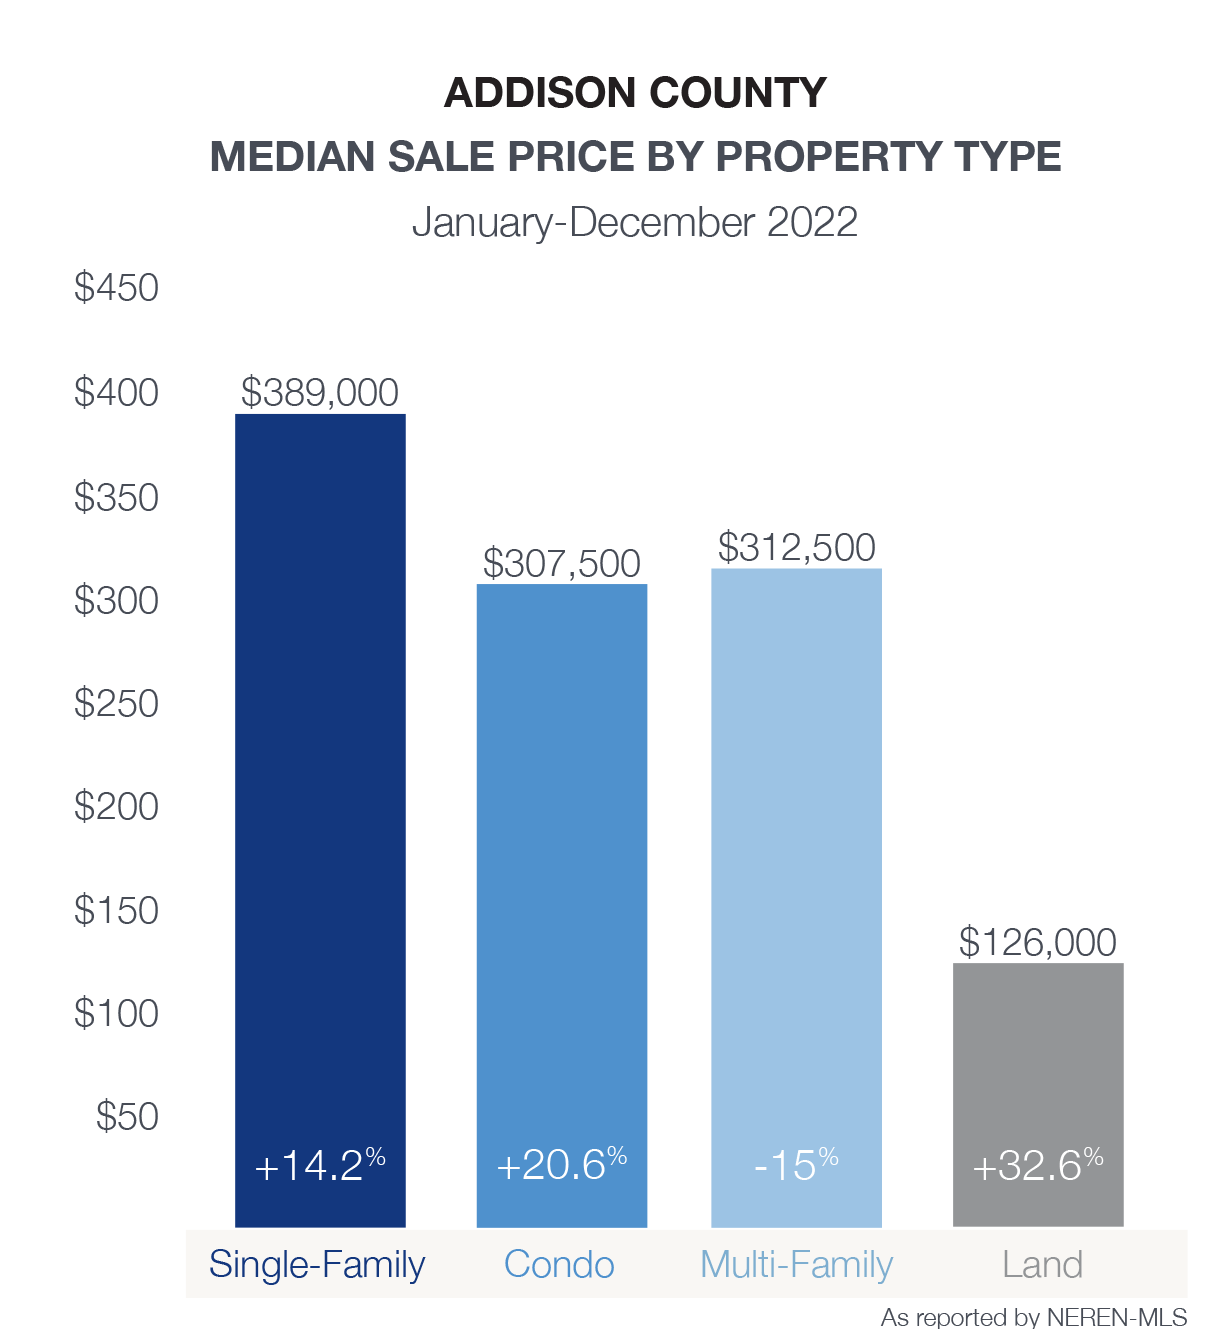
| $389,000 +14.2% | $459,171 +15.3% | 305 -27.7% | 345 -20.7% | 32 -45.8% |
| Condo January-December 2022 | ||||
|---|---|---|---|---|
| Median Sale Price: | Average Sale Price: | Units Sold: | Newly Listed: | Days on Market: |
| $307,500 +20.6% | $354,547 +22.4% | 18 -35.7% | 13 -48.0% | 24 -54.7% |
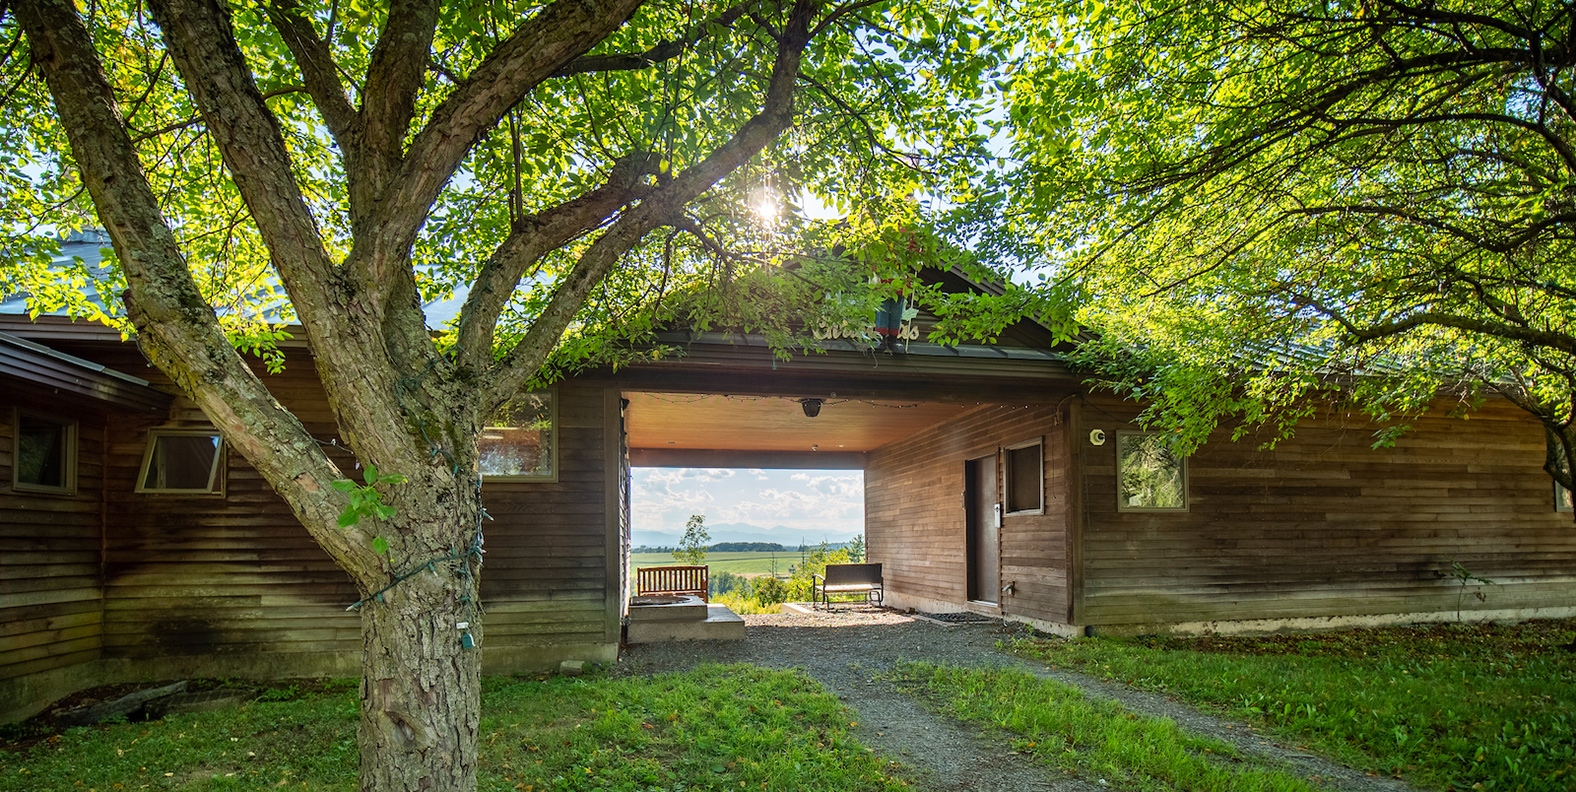
The median sale price of homes in Addison County continued its multi-year surge led by towns like Ferrisburgh, Vergennes, and Bristol. Despite reaching a record high median sale price of $389,000 for a single-family home, the county is still more affordable than nearby Chittenden County. With declining inventory of homes for sale, well prepared buyers moved quickly to purchase a property when they found one, resulting in a list to contract of only 32 days on the market. Addison County offers the quintessential Vermont life experience of farm to table dining options, art galleries, and diversified employment opportunities – all with easy access to Lake Champlain and the mountains.
| MEDIAN SALE PRICE | VS 2021 | UNITS SOLD | VS 2021 | NEWLY LISTED | VS 2021 | DAYS ON MARKET | |
|---|---|---|---|---|---|---|---|
| Addison County Single-Family | $389,000 | 14.20% | 305 | -27.70% | 345 | -20.70% | 32 |
| Addison | $497,500 | -7.90% | 16 | -5.90% | 19 | 0.00% | 35 |
| Bridport | $290,000 | -10.60% | 7 | -61.10% | 9 | -35.70% | 13 |
| Bristol | $389,000 | 20.30% | 31 | -27.90% | 33 | -15.40% | 20 |
| Cornwall | $630,000 | 15.80% | 11 | -21.40% | 14 | 7.70% | 23 |
| Ferrisburgh | $576,000 | 69.70% | 28 | 0.00% | 31 | 14.80% | 26 |
| Goshen | $369,750 | 73.70% | 4 | 33.30% | 2 | -50.00% | 58 |
| Granville | $327,713 | 118.50% | 6 | 20.00% | 5 | -44.40% | 136 |
| Hancock | $225,000 | 60.10% | 3 | -57.10% | 3 | -40.00% | 11 |
| Leicester | $300,000 | -0.40% | 15 | -16.70% | 18 | 5.90% | 15 |
| Lincoln | $386,750 | 12.10% | 18 | 20.00% | 20 | 42.90% | 49 |
| Middlebury | $367,500 | 0.70% | 46 | -32.40% | 53 | -20.90% | 28 |
| Monkton | $455,000 | 8.30% | 22 | -8.30% | 23 | -4.20% | 28 |
| New Haven | $455,000 | 8.30% | 14 | -36.40% | 17 | -26.10% | 15 |
| Orwell | $395,000 | 41.10% | 13 | -43.50% | 15 | -42.30% | 35 |
| Panton | $310,000 | -23.50% | 9 | -10.00% | 9 | -10.00% | 21 |
| Ripton | $480,000 | 37.50% | 1 | -83.30% | 1 | -87.50% | 8 |
| Salisbury | $415,000 | 23.00% | 11 | -45.00% | 10 | -58.30% | 52 |
| Shoreham | $429,000 | 30.00% | 5 | -66.70% | 9 | -52.60% | 43 |
| Starksboro | $270,000 | 1.10% | 8 | -42.90% | 9 | -50.00% | 46 |
| Vergennes | $321,000 | 21.10% | 24 | -17.20% | 27 | -15.60% | 29 |
| Waltham | $634,000 | 74.50% | 1 | -83.30% | 2 | -60.00% | 18 |
| Weybridge | $452,000 | -4.80% | 8 | -38.50% | 13 | 8.30% | 19 |
| Whiting | $324,500 | 22.70% | 4 | 0.00% | 3 | -50.00% | 111 |