| Single-Family January-December 2020 | ||||
|---|---|---|---|---|
| Median Sale Price: | Average Sale Price: | Units Sold: | Newly Listed: | Days on Market: |
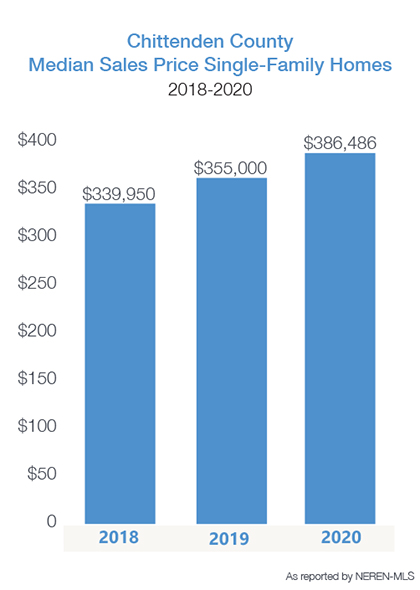
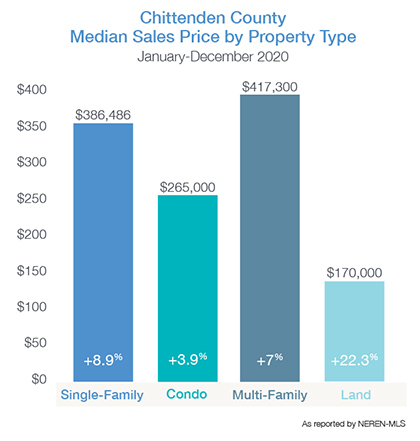
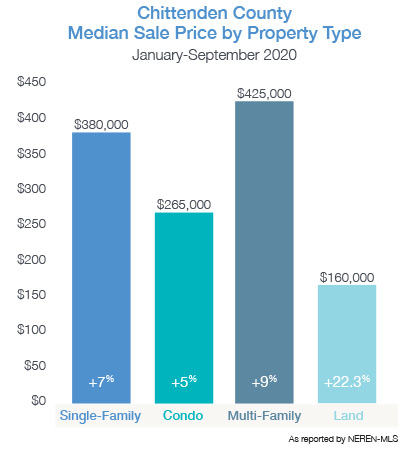
| $386,486 +8.9% | $452,875 +10.8% | 1,346 -4.1% | 1,497 -13% | 44 -2.2% |
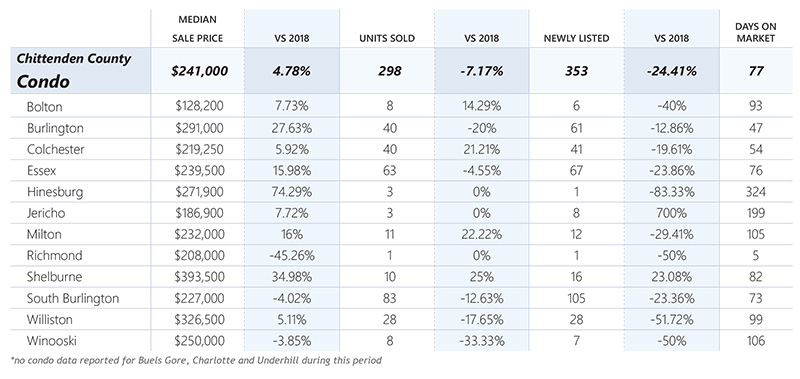
| Condo January-December 2020 | ||||
|---|---|---|---|---|
| Median Sale Price: | Average Sale Price: | Units Sold: | Newly Listed: | Days on Market: |
| $265,000 +3.9% | $291,420 +2.7% | 717 +7% | 719 -2.8% | 44 -25.4% |
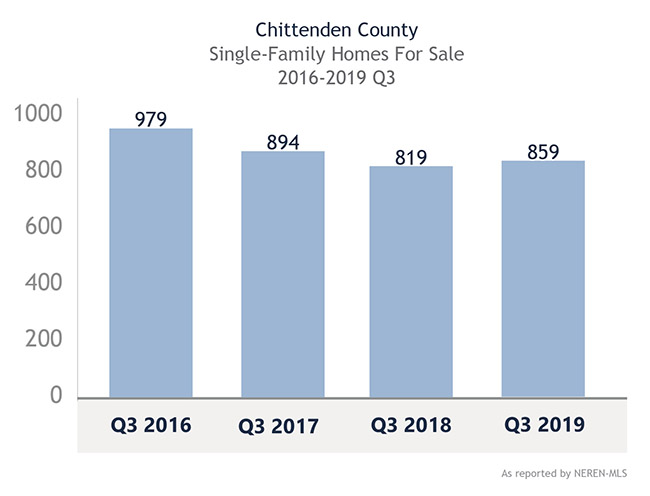
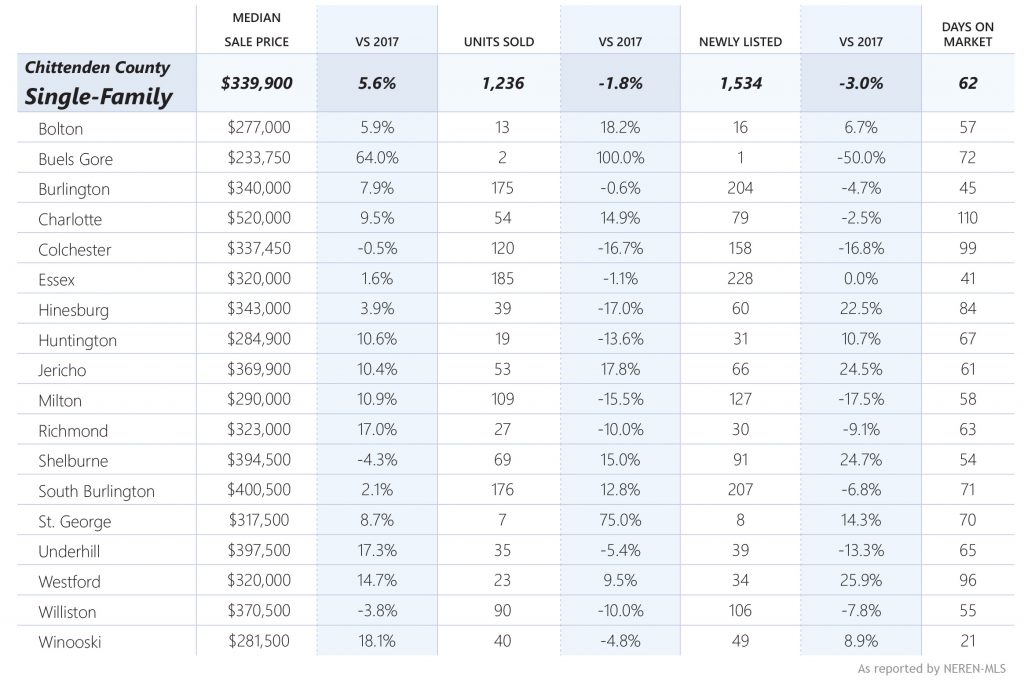
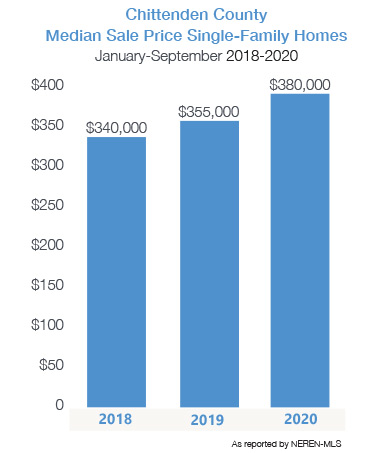
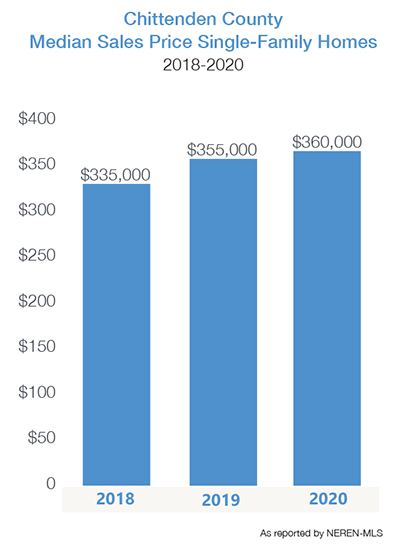
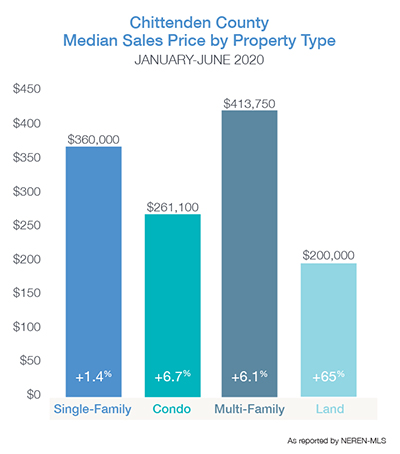
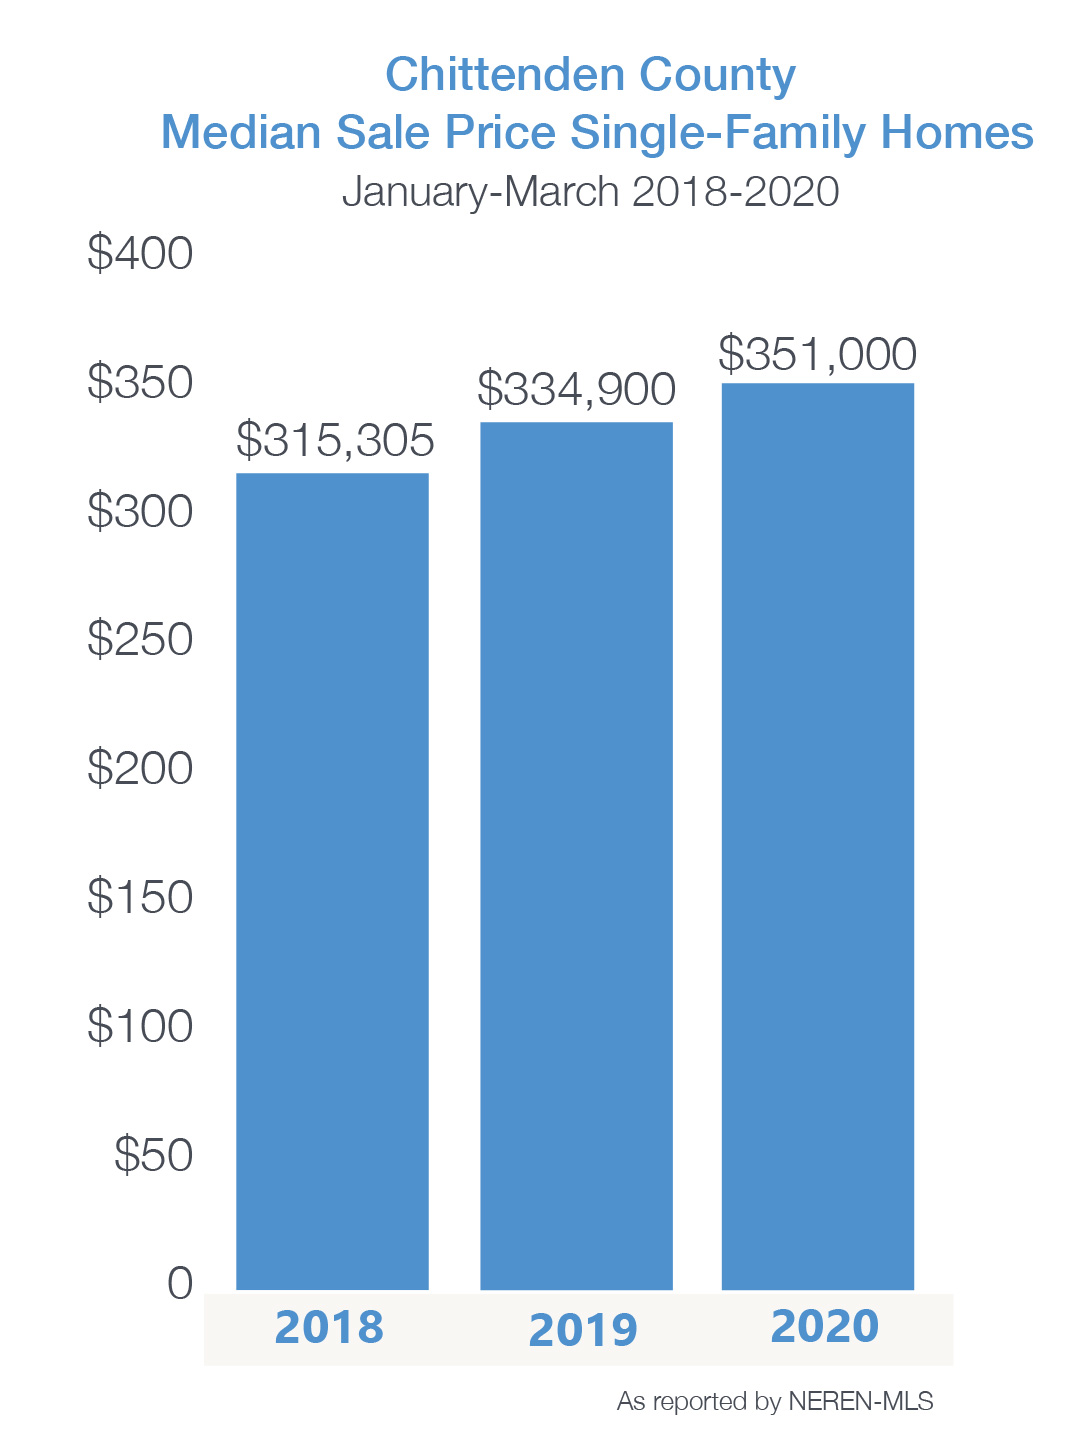
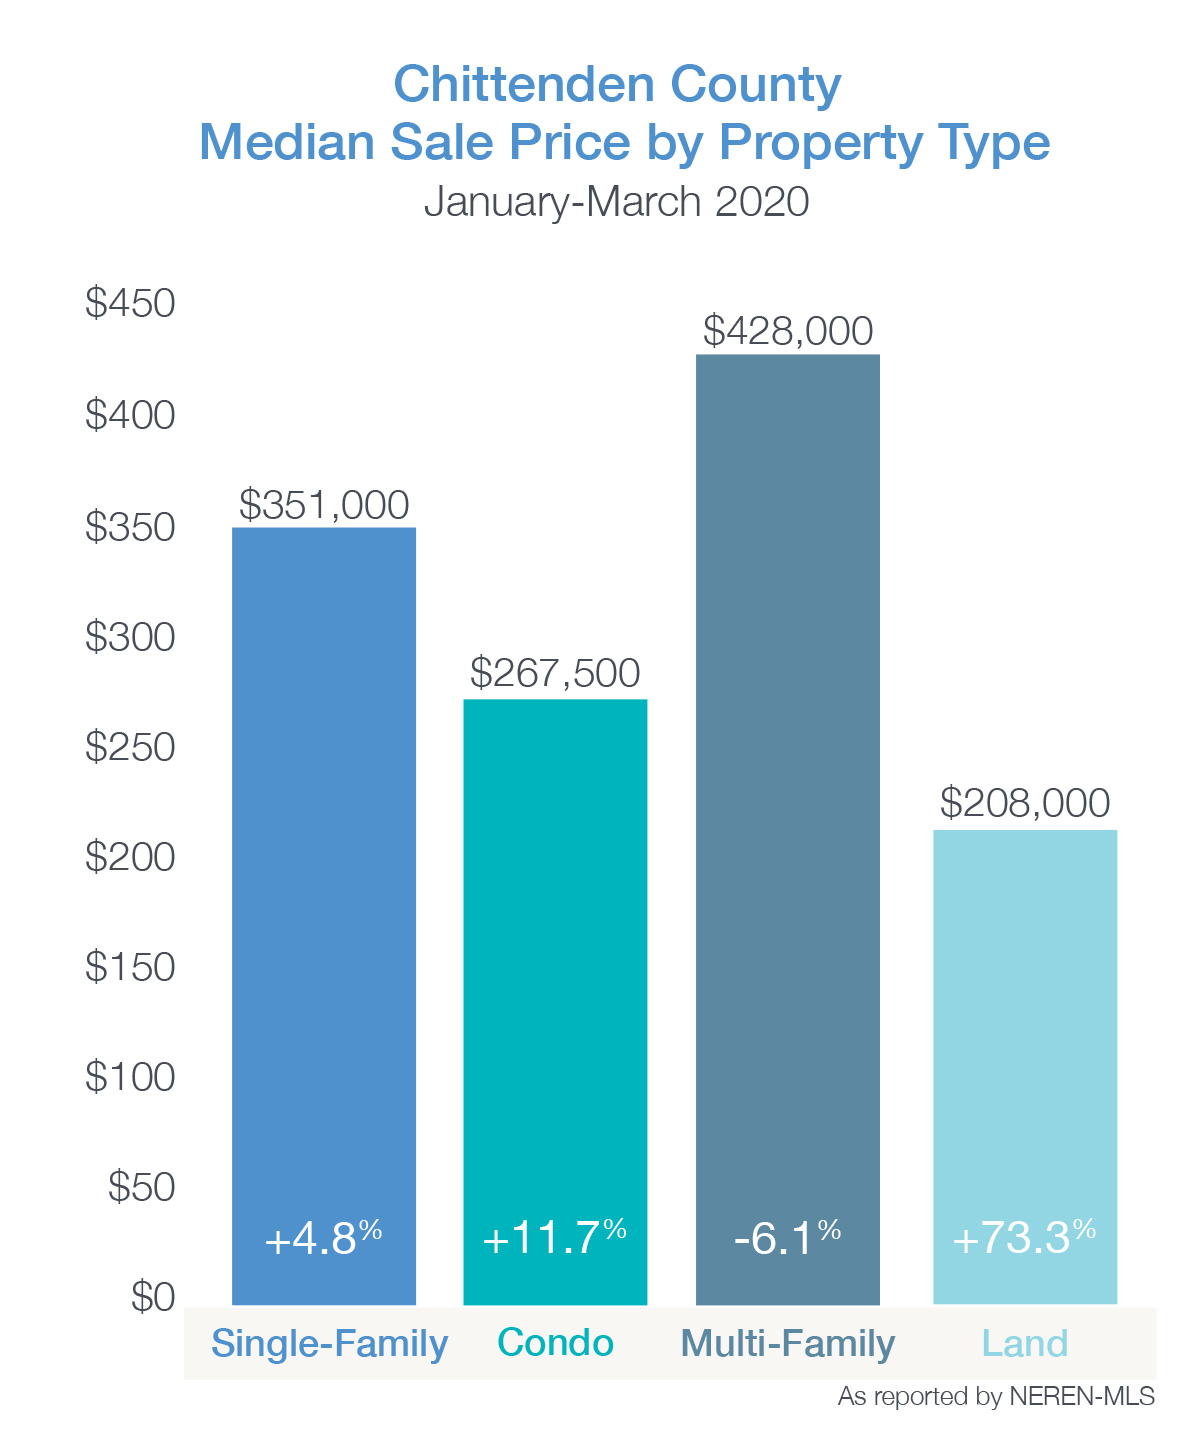
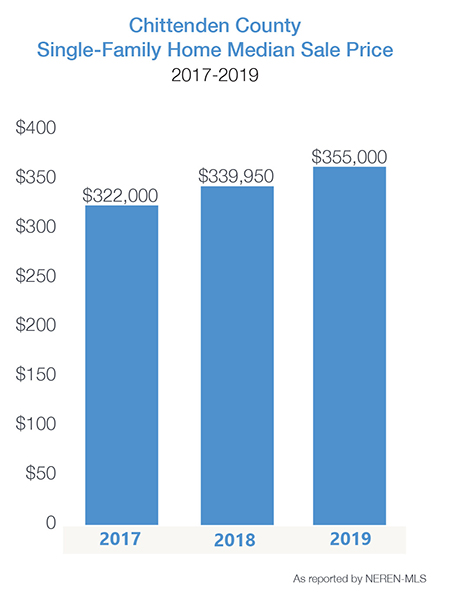
The median sale price for single-family homes in Chittenden County increased by nearly 9% in 2020 and 14% over the previous 2 years. Newly listed homes went under contract quickly – many with multiple offers creating upward pressure on pricing in an already undersupplied market.
Many buyers have turned to new construction in communities like Hillside at O’Brien Farm and South Village – both in South Burlington. New builds offer buyers time to make selections in location, floorplans, and finishes while not competing in the frenzied re-sale market. However, supply chain disruptions and increased cost for materials are pressuring builders who want to deliver a high-quality product on time.
With the increase in median sale price comes an increase in the equity position for many homeowners. The time to list may be right for Sellers who have postponed a move to list their home. Showing practices during COVID-19 are efficient and less intrusive then they were pre-pandemic. In most cases, only well-qualified buyers who have viewed homes online – via video and photos – narrowed their search to your home will physically enter your property. Many qualified buyers are waiting for the right property to hit the market; so savvy sellers, with guidance from their agent, will list their home now and not wait until the spring.
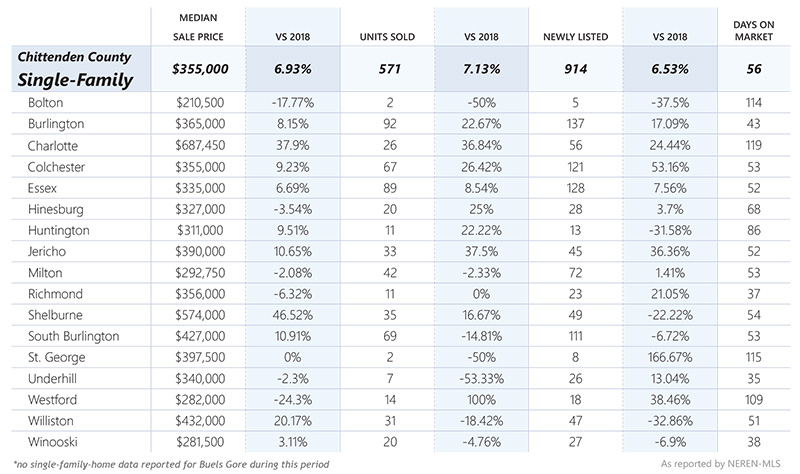
| MEDIAN SALE PRICE | VS 2019 | UNITS SOLD | VS 2019 | NEWLY LISTED | VS 2019 | DAYS ON MARKET | |
|---|---|---|---|---|---|---|---|
| Chittenden County Single-Family | $386,486 | 8.90% | 1346 | -4.10% | 1497 | -13.00% | 44 |
| Bolton | $279,500 | -1.10% | 10 | 0.00% | 12 | 9.10% | 35 |
| Buels Gore | n/a | n/a | n/a | n/a | n/a | n/a | n/a |
| Burlington | $379,950 | 9.50% | 210 | -3.70% | 220 | -15.40% | 32 |
| Charlotte | $631,750 | 21.00% | 62 | -6.10% | 66 | -26.70% | 116 |
| Colchester | $392,000 | 7.80% | 158 | -4.80% | 171 | -21.20% | 38 |
| Essex | $366,250 | 7.80% | 192 | -5.40% | 224 | -5.90% | 38 |
| Hinesburg | $400,000 | 14.60% | 29 | -43.10% | 38 | -25.50% | 57 |
| Huntington | $256,500 | -21.20% | 22 | -8.30% | 22 | 4.80% | 86 |
| Jericho | $404,000 | 4.90% | 53 | -23.20% | 64 | -25.60% | 49 |
| Milton | $315,500 | 8.80% | 114 | -1.70% | 127 | -5.20% | 26 |
| Richmond | $385,000 | 10.00% | 37 | 19.40% | 35 | -20.50% | 55 |
| Shelburne | $620,000 | 3.80% | 72 | -5.30% | 85 | -3.40% | 56 |
| South Burlington | $478,000 | 11.20% | 179 | 5.90% | 215 | -4.00% | 40 |
| St. George | $452,000 | 4.10% | 9 | 12.50% | 10 | -9.10% | 41 |
| Underhill | $359,950 | 10.30% | 36 | 0.00% | 35 | -30.00% | 34 |
| Westford | $370,000 | 17.50% | 33 | 13.80% | 30 | -21.10% | 81 |
| Williston | $480,068 | 20.90% | 92 | 9.50% | 106 | -1.90% | 36 |
| Winooski | $305,500 | 14.50% | 38 | -20.80% | 37 | -24.50% | 23 |
| MEDIAN SALE PRICE | VS 2019 | UNITS SOLD | VS 2019 | NEWLY LISTED | VS 2019 | DAYS ON MARKET | |
|---|---|---|---|---|---|---|---|
| Chittenden County Condo | $265,000 | 3.90% | 717 | 7.00% | 719 | -2.80% | 44 |
| Bolton | $119,500 | -9.10% | 17 | 54.60% | 17 | 112.50% | 49 |
| Burlington | $290,000 | 6.60% | 110 | 2.80% | 120 | -7.70% | 32 |
| Charlotte | n/a | n/a | n/a | n/a | n/a | n/a | n/a |
| Colchester | $289,000 | 29.00% | 83 | 13.70% | 75 | -17.60% | 63 |
| Essex | $236,500 | -4.40% | 136 | -1.50% | 138 | -1.40% | 42 |
| Hinesburg | $225,750 | -17.10% | 2 | -75.00% | 4 | -42.90% | 85 |
| Jericho | $277,500 | -4.80% | 14 | 27.30% | 14 | 40.00% | 49 |
| Milton | $235,000 | 10.00% | 27 | -3.60% | 26 | -16.10% | 33 |
| Richmond | $245,500 | 15.80% | 2 | -33.30% | 3 | 0.00% | 25 |
| Shelburne | $305,250 | -18.60% | 31 | 34.80% | 28 | -17.70% | 44 |
| South Burlington | $245,000 | 1.70% | 206 | 12.60% | 196 | -6.70% | 53 |
| Williston | $309,000 | -3.60% | 61 | -16.40% | 65 | 3.20% | 21 |
| Winooski | $262,000 | 4.80% | 27 | 125.00% | 32 | 166.70% | 24 |
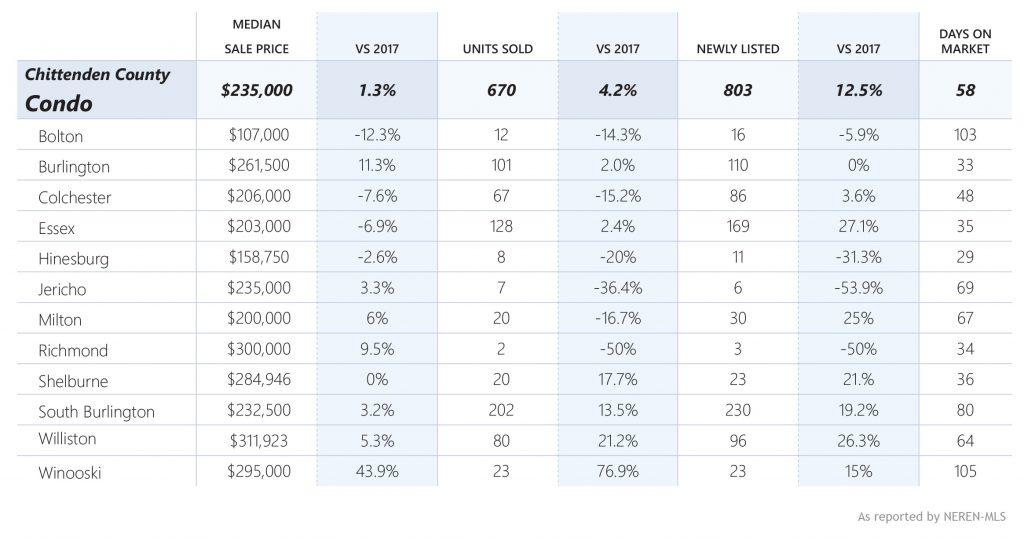
 Buyers acted quickly when the right property caught their eye resulting in only 42 days on the market (DOM) – the number of days from list to contract; the lowest we’ve seen in many years. In some key price points and locations, the “DOM” is in the single digits.

 With “days on the market” (the time from listing to closing) at only 1.5 months, buyers must be well prepared to act fast with the assistance of their REALTOR if they want to achieve their dream of home ownership in 2020.