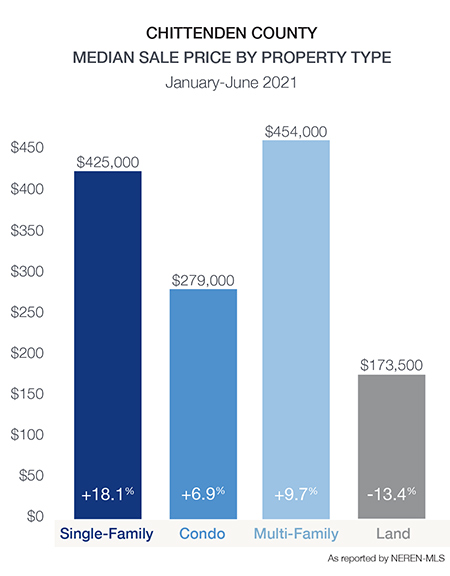
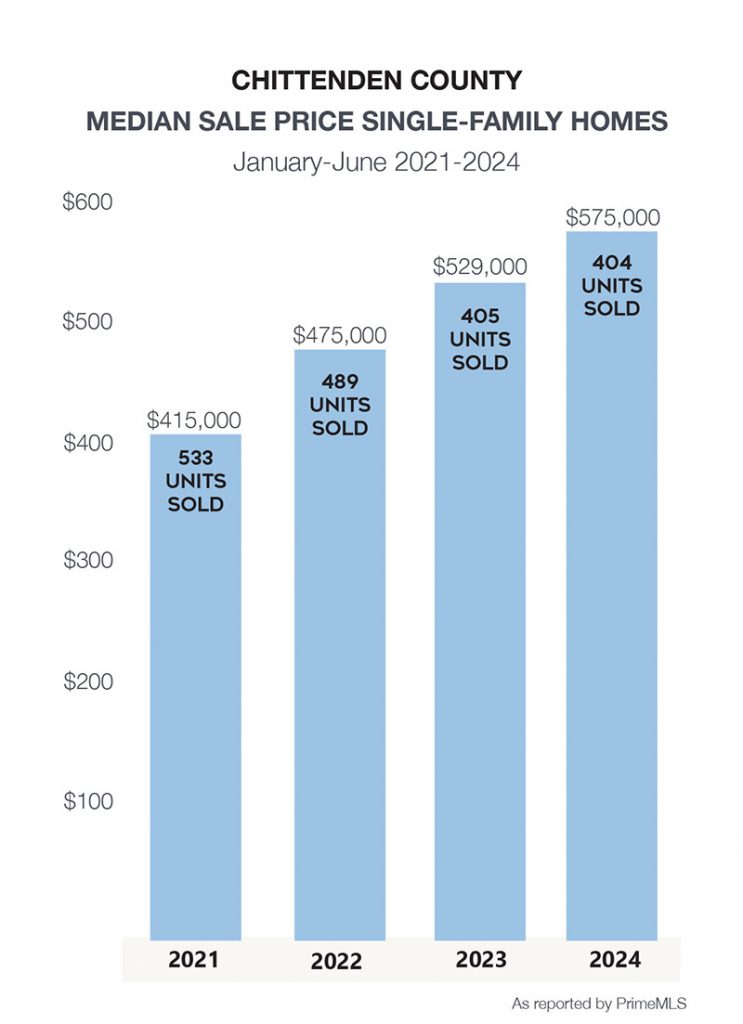
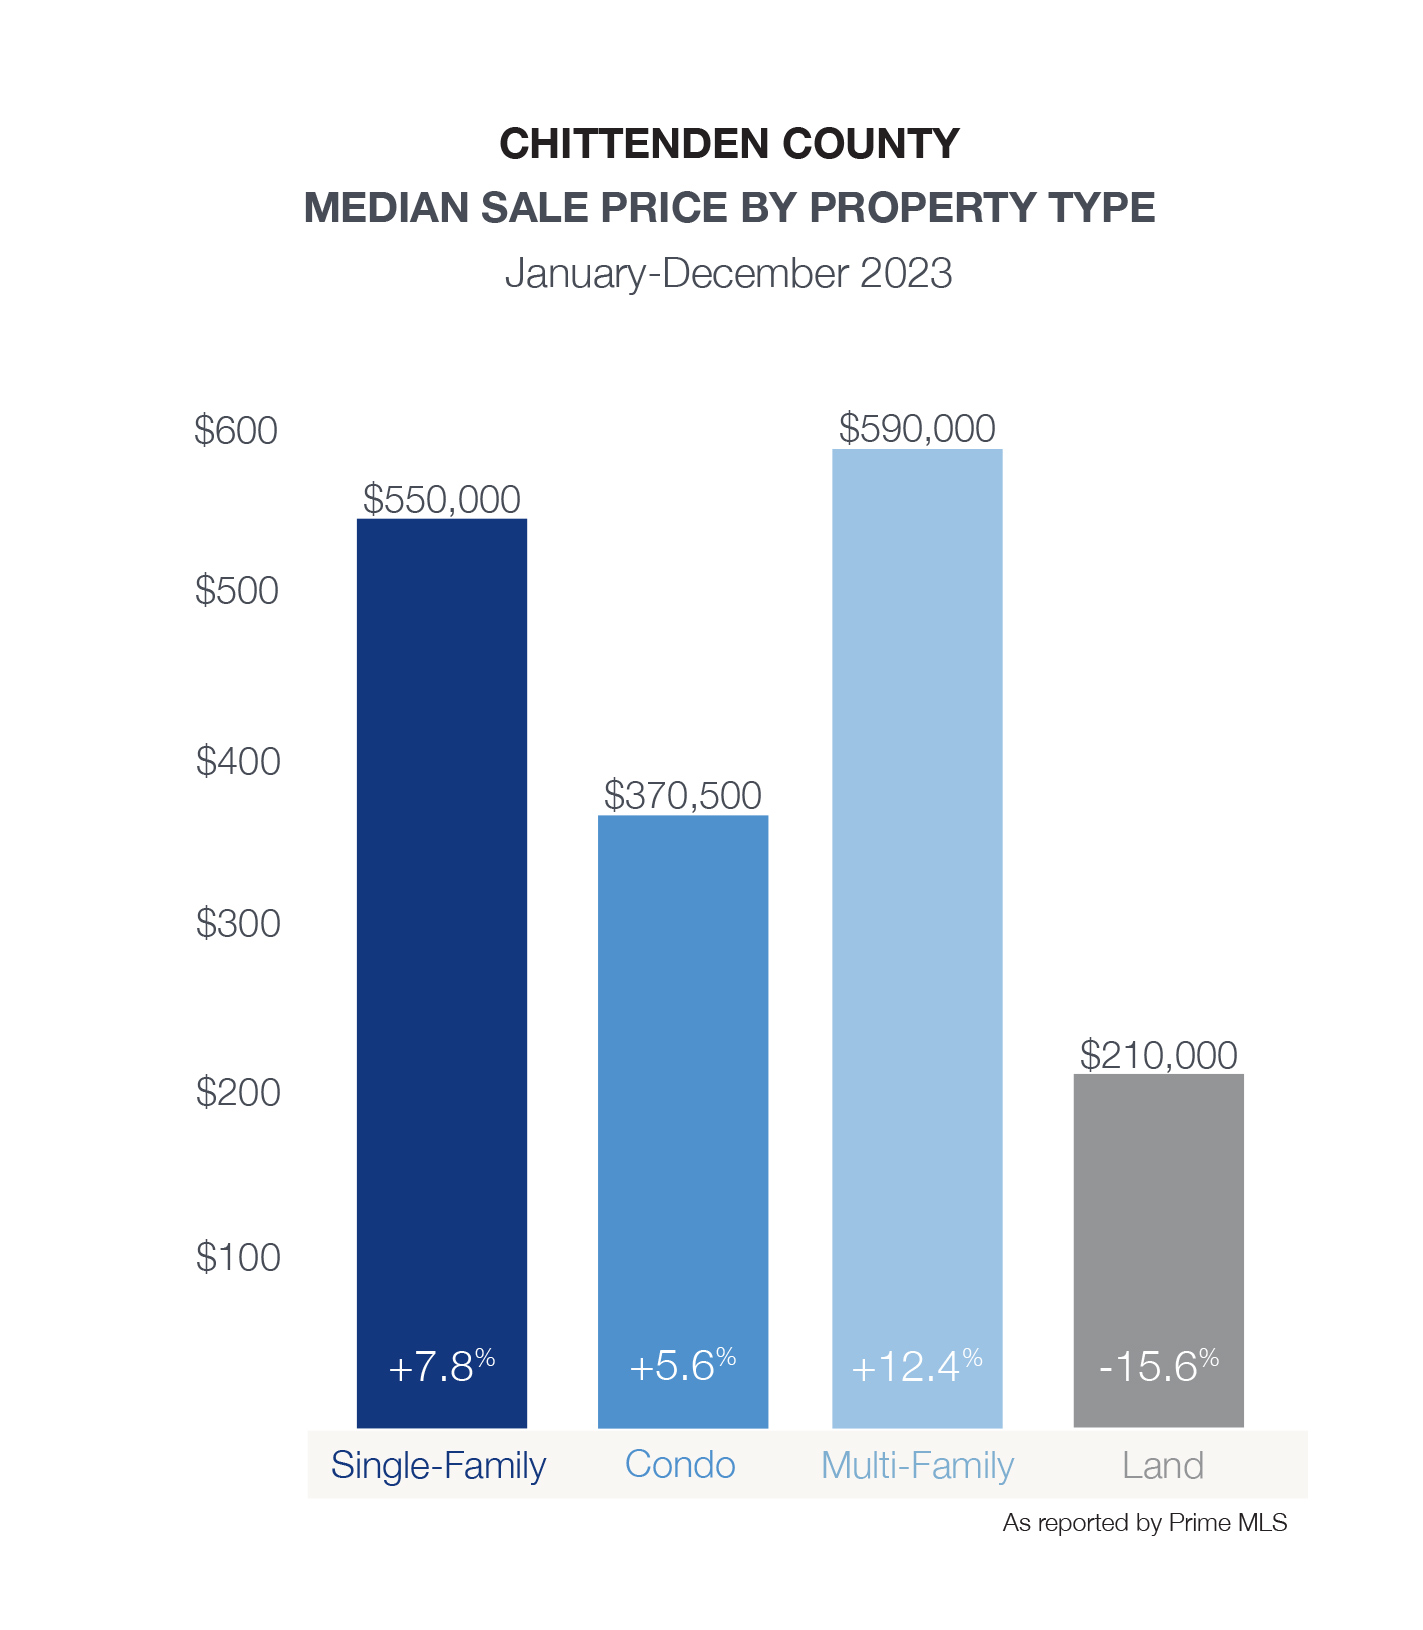
The Chittenden County real estate market remains robust in 2025, especially in the single-family segment, where prices rose modestly and sales volume increased sharply. The median sales price for single-family homes reached $590,000, a 2.61% increase.
| Single-Family January-June 2025 | ||||
|---|---|---|---|---|
| Median Sale Price: | Average Sale Price: | Units Sold: | Newly Listed: | Days on Market: |
| $590,000 | 2.61% | $662,782 | -2.9% | 465 | 15.1% | 732 | 21.6% | 32 | 3.2% |
| Condos January-June 2025 | ||||
|---|---|---|---|---|
| Median Sale Price: | Average Sale Price: | Units Sold: | Newly Listed: | Days on Market: |
| $384,950 | 8.9% | $420,666 | 2.3% | 234 | -7.9% | 384 | -1.8% | 39 | 69.5% |
Sales volume jumped 15.1% year-over-year to 465 homes sold, and new listings increased by over 21%, improving opportunities for buyers. However, homes moved quickly, with an average of just 32 days on market, indicating continued strong demand in Vermont’s most competitive housing region.
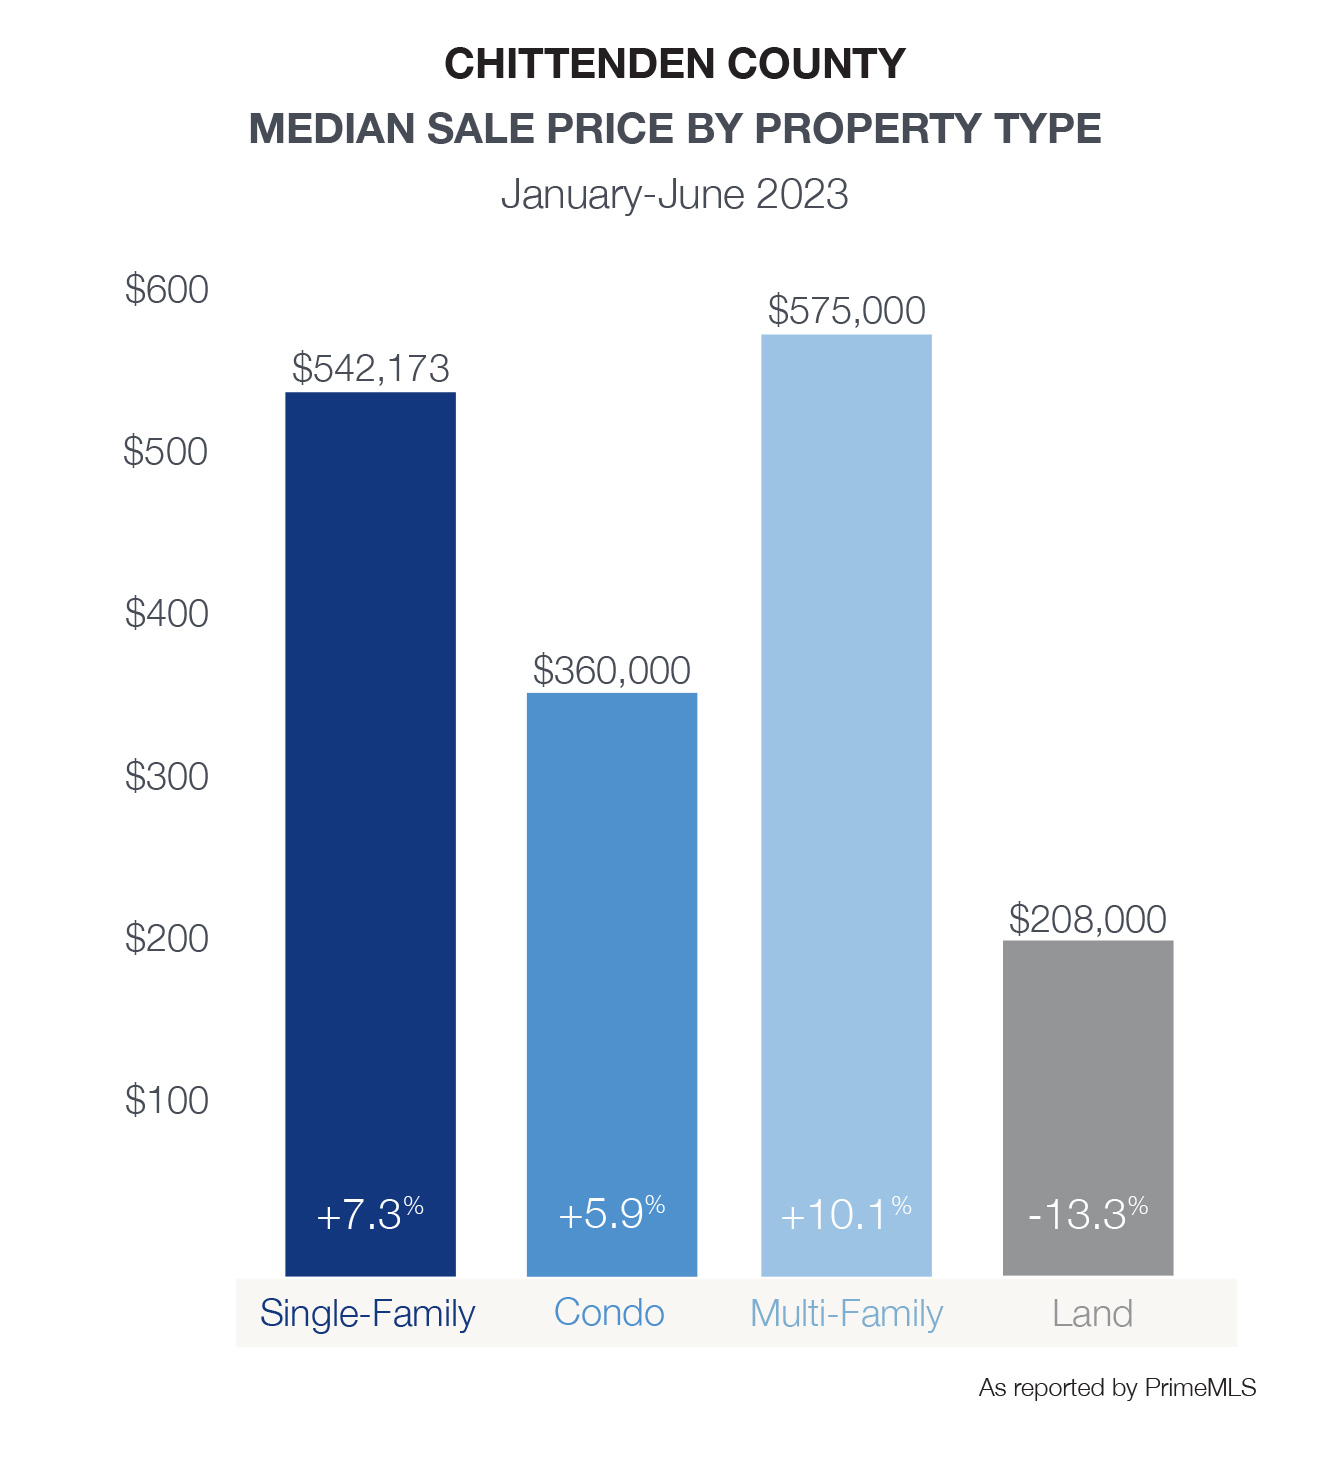
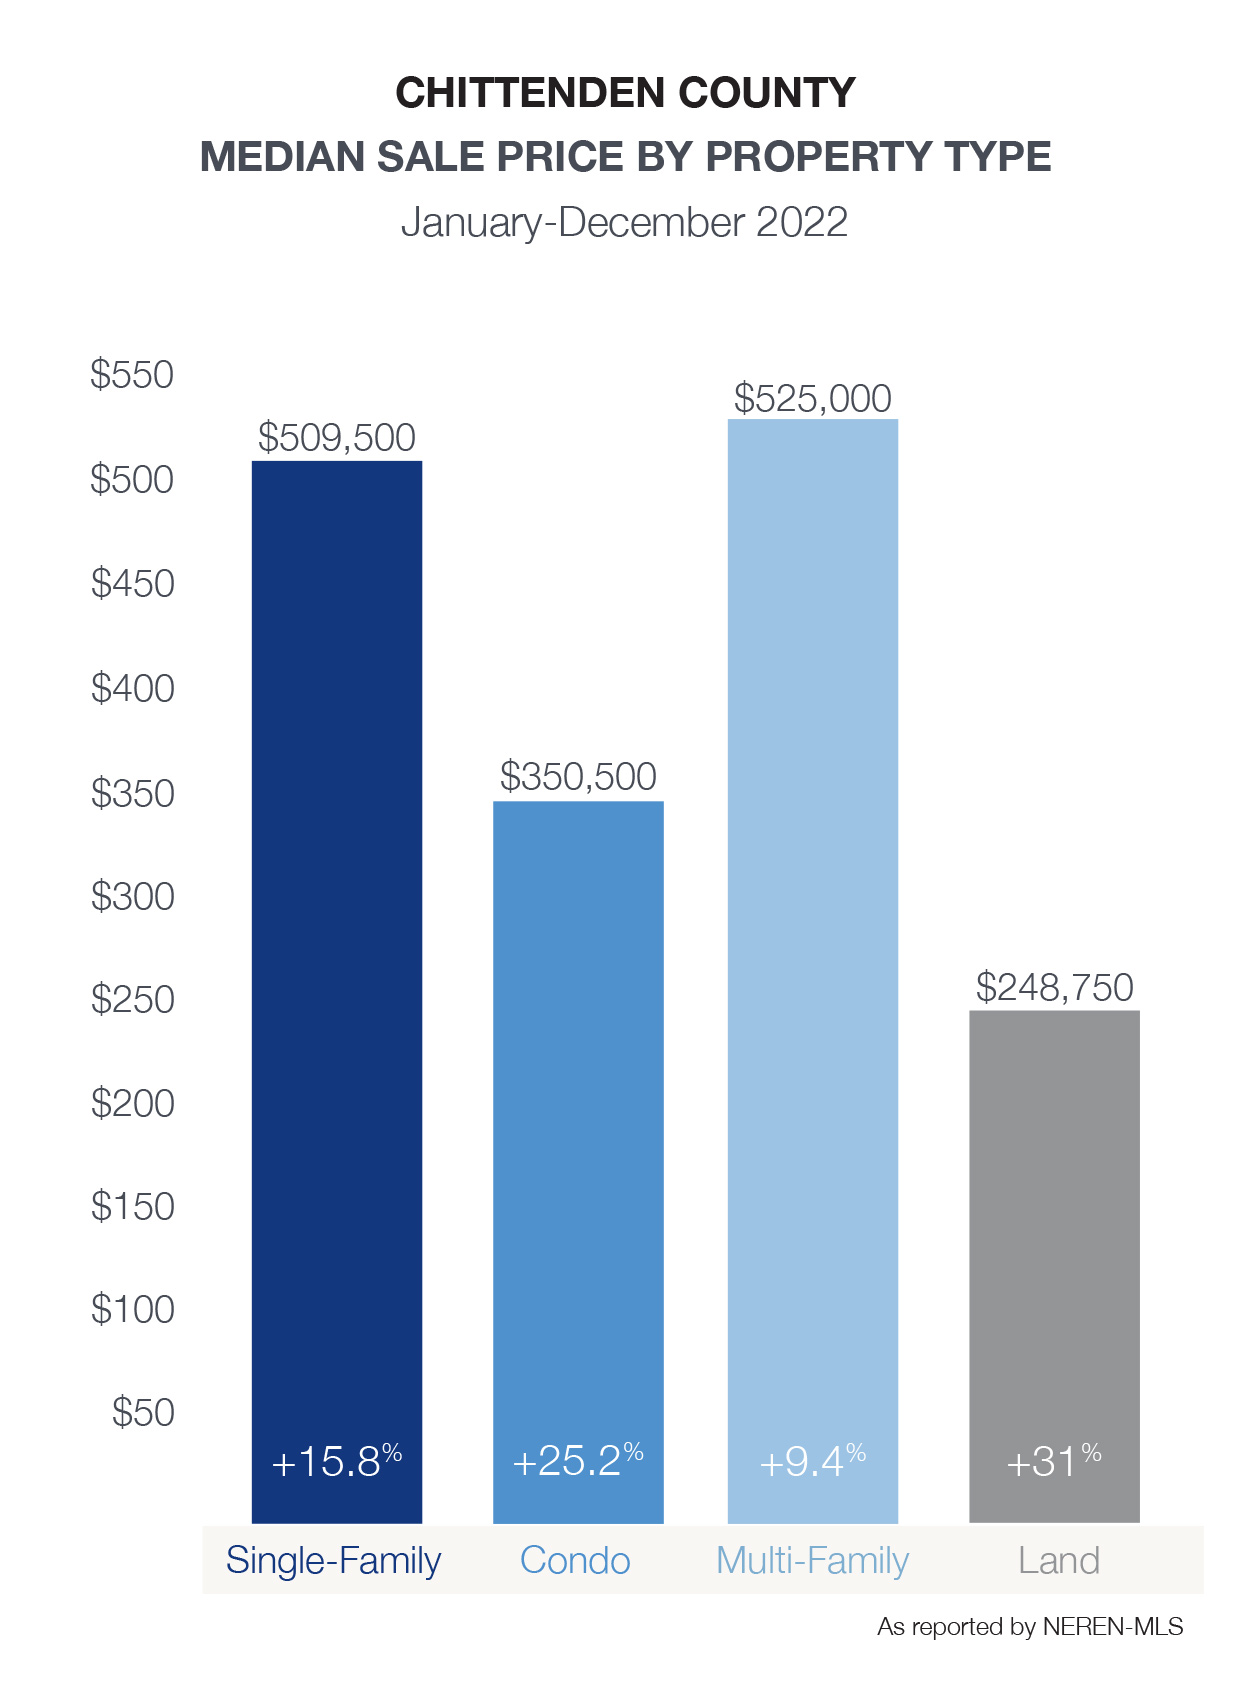
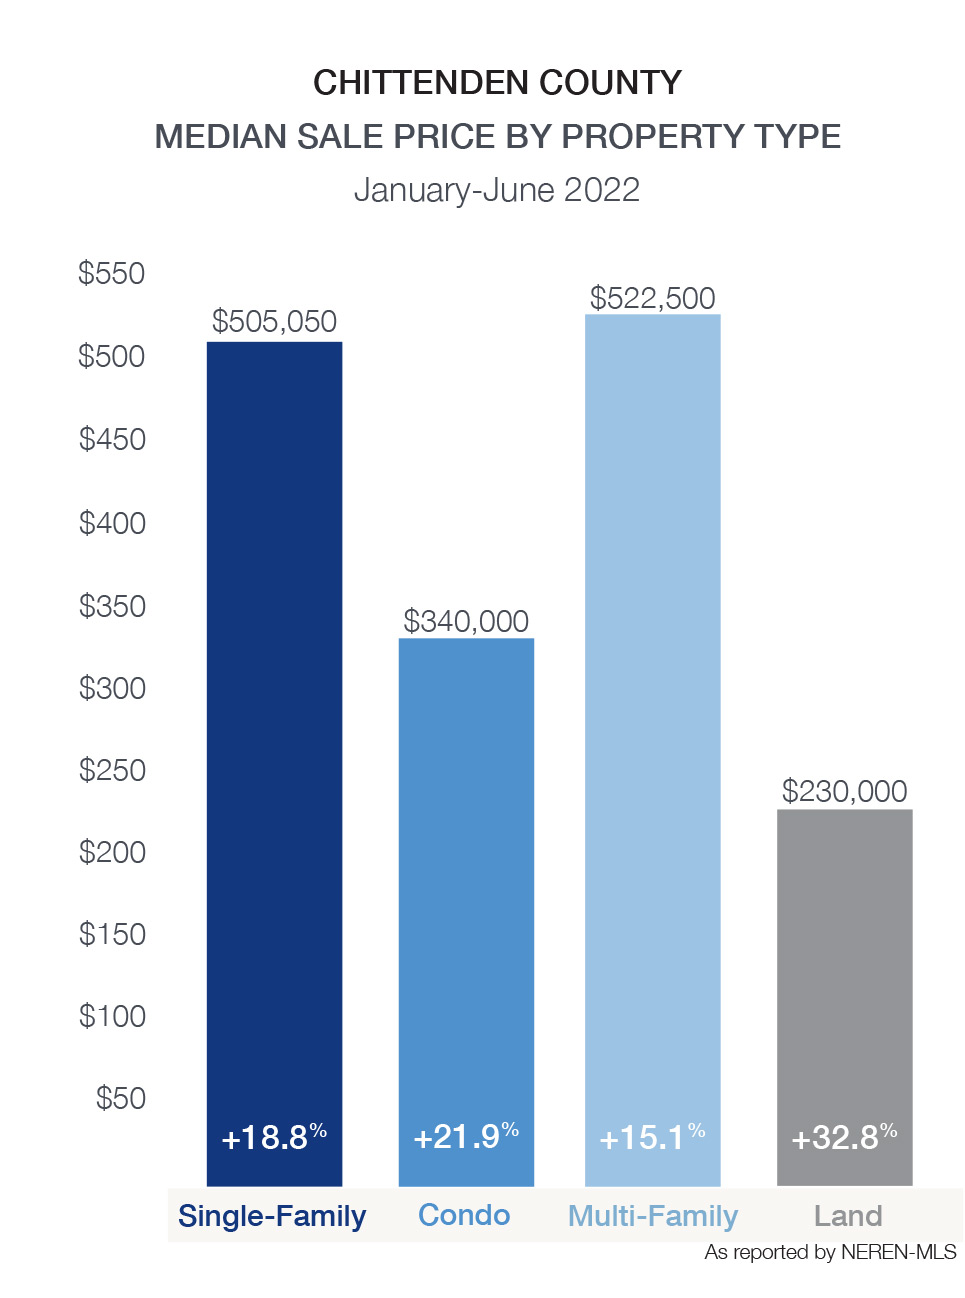
The condominium market had a mixed year. The median sale price rose 8.86% to $384,950, and the average sale price increased 2.34% to $420,666, showing steady appreciation. Although the number of sales fell by nearly 8%, while new listings and market pace remained mostly flat, this may be a result of the product mix available versus buyer demand. Meanwhile, multi-family properties surged in activity, with 58 units sold—a 75% increase—and moderate price growth. Land sales also edged up slightly, reflecting growing interest from buyers seeking building opportunities
At the town level, Burlington led in activity, with 78 single-family homes sold, and a modest median sales price gain to $547,500. South Burlington also stood out with 76 homes sold and a 15% median sold price increase to $690,000. In Charlotte, high-end activity pushed the median single-family sold price to over $1 million, a 54% increase. Shelburne and Richmond also posted strong median price gains—up 33% and 27%, respectively—highlighting ongoing luxury demand. Conversely, Essex, Milton, and Williston saw flat or slightly negative price movement, with modest declines in unit sales. Smaller towns like Hinesburg, Bolton, and St. George had highly variable results due to limited sample sizes.
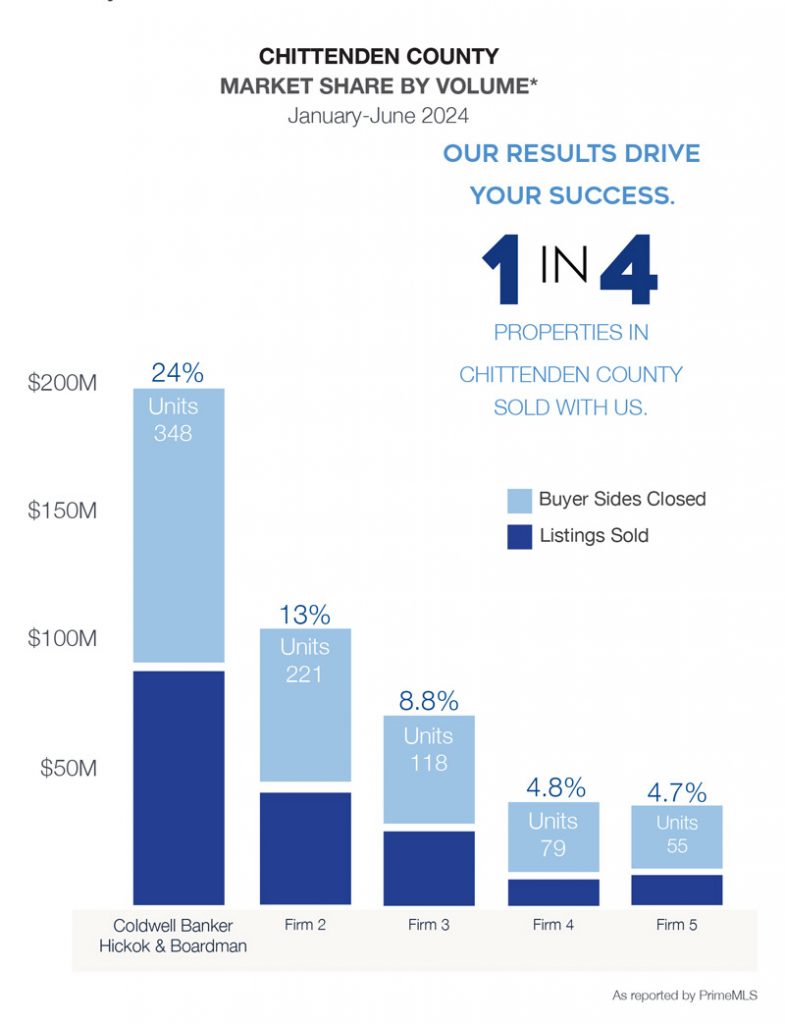
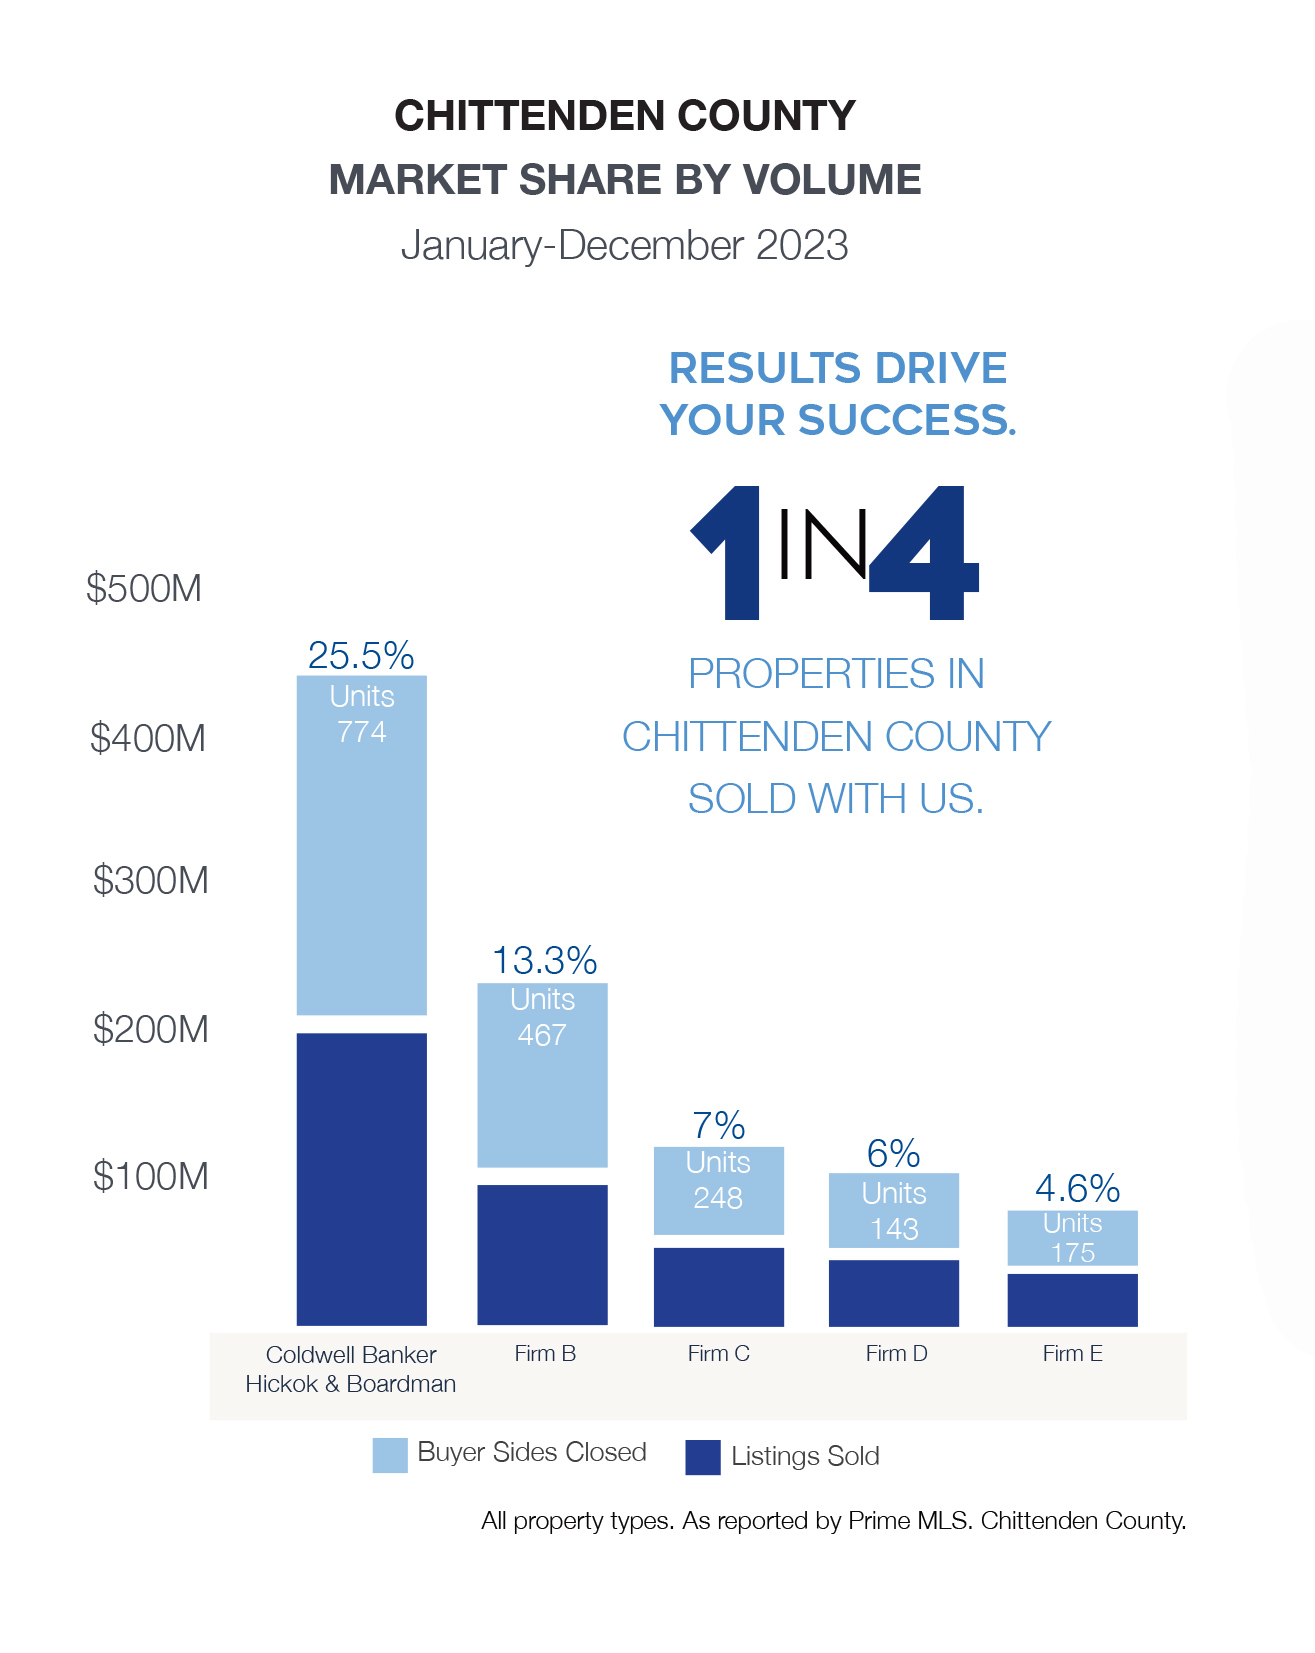
With a commanding 26% market share, Coldwell Banker Hickok & Boardman Agents are the market leaders in Chittenden County real estate– successfully guiding more than 400 property owners so far in 2025.
| Chittenden County Single-Family | Median Price | VS 2024 | Units Sold | VS 2024 | New Listings | VS 2024 | Average DOM |
|---|---|---|---|---|---|---|---|
| Chittenden County | $590,000.00 | 2.6% | 465 | 15.1% | 732 | 21.6% | 32 |
| Bolton | $400,000.00 | -27.0% | 1 | -66.7% | 4 | 33.3% | 0 |
| Burlington | $547,500.00 | 3.2% | 78 | 8.3% | 112 | 0.0% | 33 |
| Charlotte | $1,039,163.00 | 54.0% | 20 | 53.9% | 29 | 38.1% | 53 |
| Colchester | $562,000.00 | 0.4% | 49 | 44.1% | 83 | 40.7% | 32 |
| Essex | $567,000.00 | -0.1% | 53 | -17.2% | 96 | 12.9% | 24 |
| Hinesburg | $489,000.00 | -34.7% | 11 | -35.3% | 24 | -7.7% | 23 |
| Huntington | $462,858.00 | 63.8% | 8 | 300.0% | 11 | 120.0% | 28 |
| Jericho | $600,000.00 | 6.2% | 23 | 27.8% | 32 | 18.5% | 73 |
| Milton | $490,000.00 | -2.0% | 38 | -2.6% | 57 | 29.6% | 25 |
| Richmond | $667,500.00 | 27.1% | 8 | -20.0% | 16 | -30.4% | 43 |
| Shelburne | $917,000.00 | 32.9% | 28 | 64.7% | 46 | 58.6% | 15 |
| South Burlington | $690,000.00 | 15.2% | 76 | 40.7% | 121 | 37.5% | 30 |
| St. George | $490,000.00 | -44.6% | 3 | 200.0% | 1 | -50.0% | 72 |
| Underhill | $599,950.00 | -22.6% | 18 | 50.0% | 24 | 33.3% | 25 |
| Westford | $510,000.00 | 36.0% | 6 | -14.3% | 13 | 18.2% | 35 |
| Williston | $655,000.00 | -11.8% | 31 | -8.8% | 44 | 25.7% | 26 |
| Winooski | 408500 | -0.4% | 14 | 100.0% | 19 | 35.7% | 35 |
| Chittenden County Condo | Median Price | VS 2024 | Units Sold | VS 2024 | New Listings | VS 2024 | Average DOM |
|---|---|---|---|---|---|---|---|
| Chittenden County | $384,950.00 | 8.9% | 234 | -7.9% | 384 | -1.8% | 39 |
| Bolton | $395,000.00 | 25.4% | 5 | 25.0% | 3 | -25.0% | 19 |
| Burlington | $400,000.00 | 25.0% | 51 | 13.3% | 86 | -1.2% | 53 |
| Charlotte | $439,000.00 | 25.4% | 1 | 0.0% | 1 | -50.0% | 9 |
| Colchester | $357,000.00 | -1.3% | 31 | 29.2% | 40 | 8.1% | 24 |
| Essex | $365,000.00 | 3.3% | 39 | 0.0% | 67 | 21.8% | 22 |
| Hinesburg | $371,900.00 | -31.8% | 1 | 0.0% | 5 | 66.7% | 6 |
| Jericho | $369,000.00 | 7.0% | 3 | 0.0% | 4 | 100.0% | 5 |
| Milton | $401,000.00 | -18.0% | 9 | -35.7% | 33 | 94.1% | 148 |
| Richmond | 0.0% | 0.0% | 0.0% | ||||
| Shelburne | $423,500.00 | -17.0% | 10 | -23.1% | 20 | -31.0% | 35 |
| South Burlington | $340,263.00 | 0.4% | 54 | -30.8% | 84 | -22.2% | 27 |
| Williston | $557,925.00 | 21.3% | 19 | -24.0% | 31 | -13.9% | 59 |
| Winooski | $405,000.00 | 19.5% | 11 | 57.1% | 10 | 0.0% | 38 |
Footnotes:
- PrimeMLS, PrimeMLS.com,
 South Burlington’s drop-in single-family sales reflects a shift in new construction sales during the first half of 2023 vs 2024. As O’Brien’s
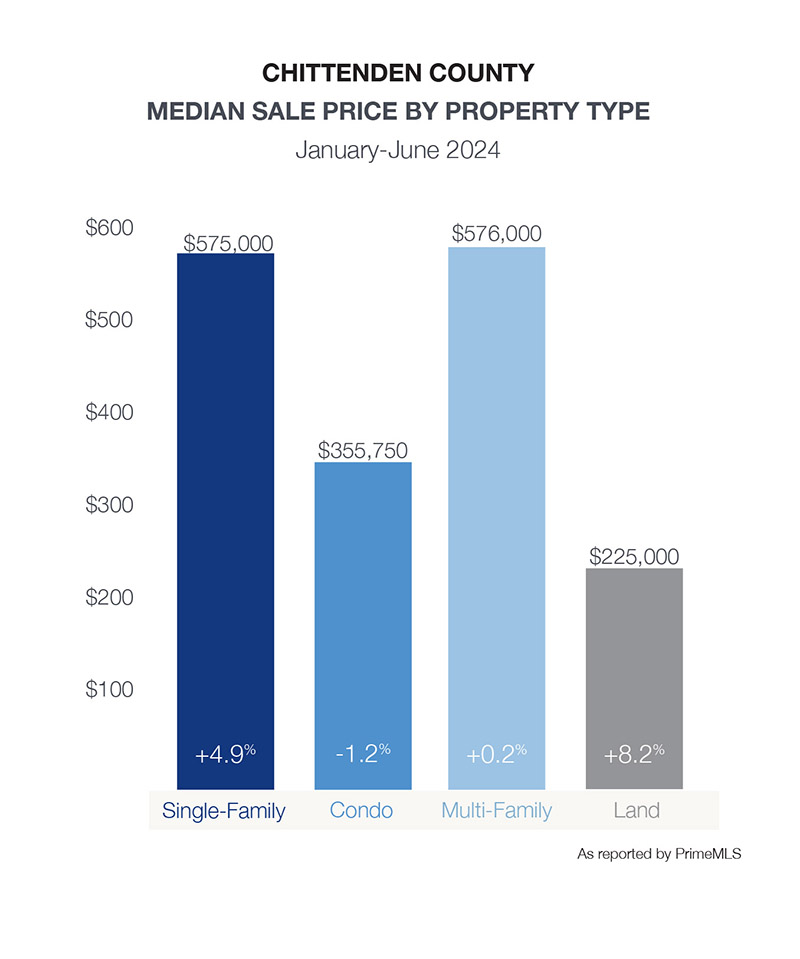
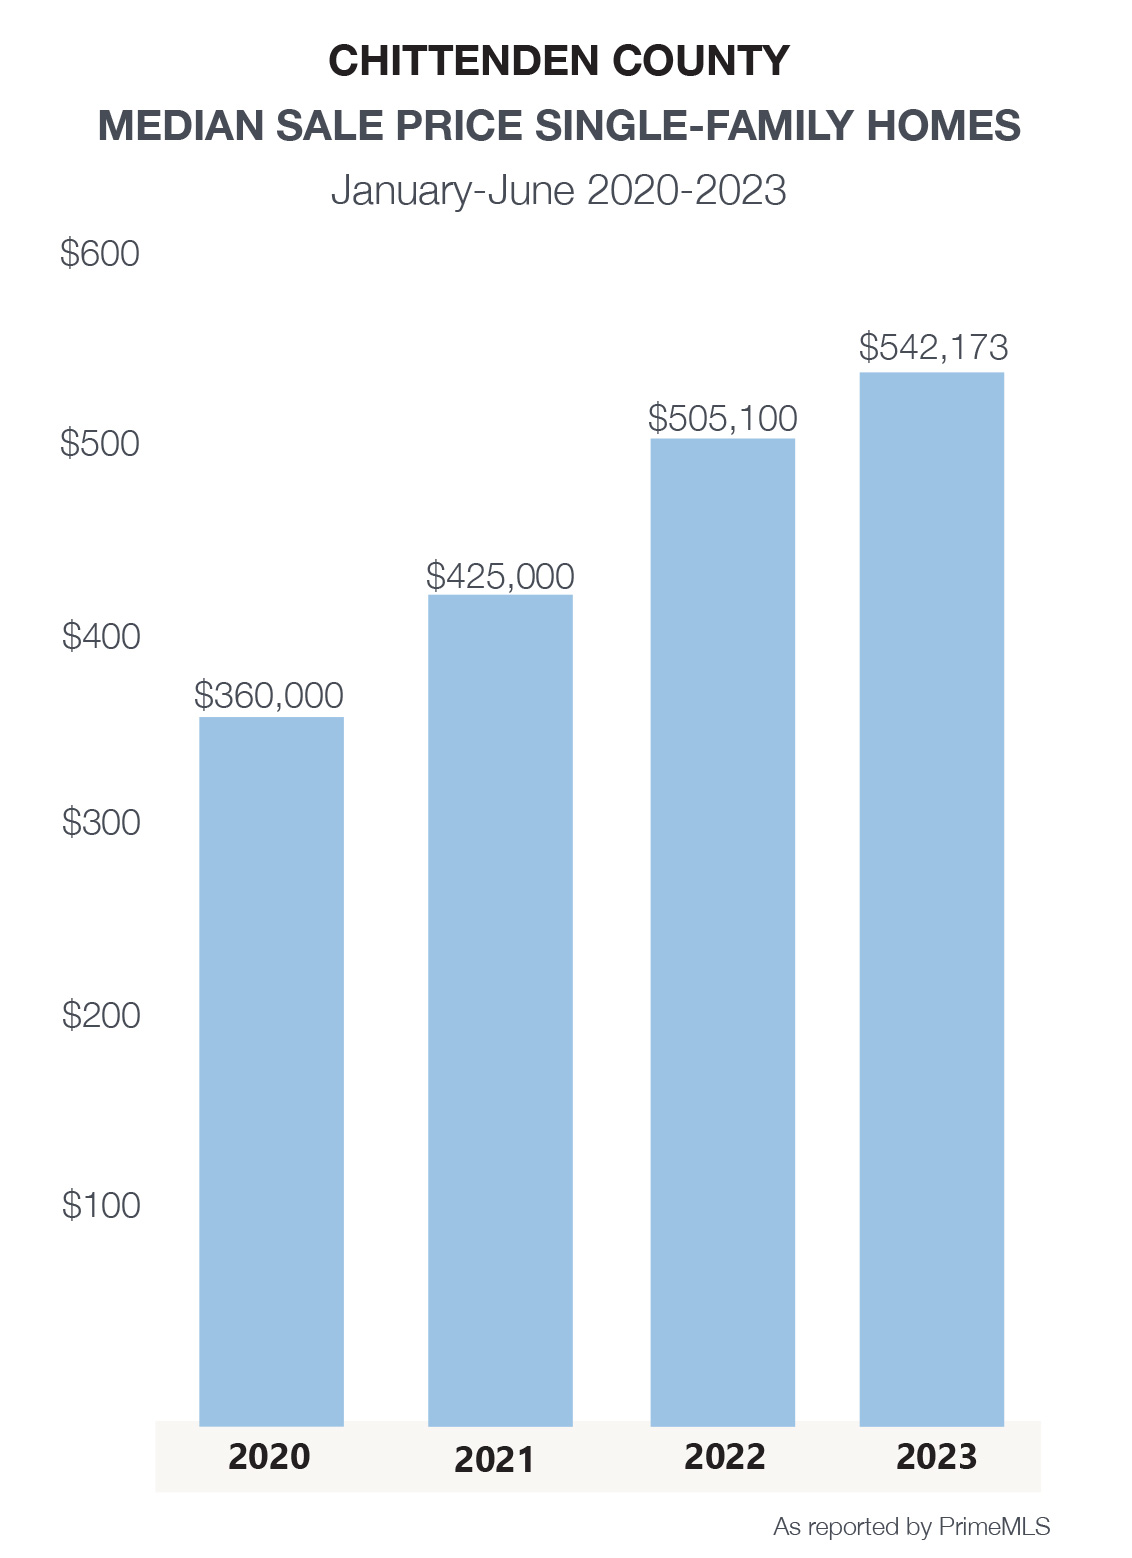
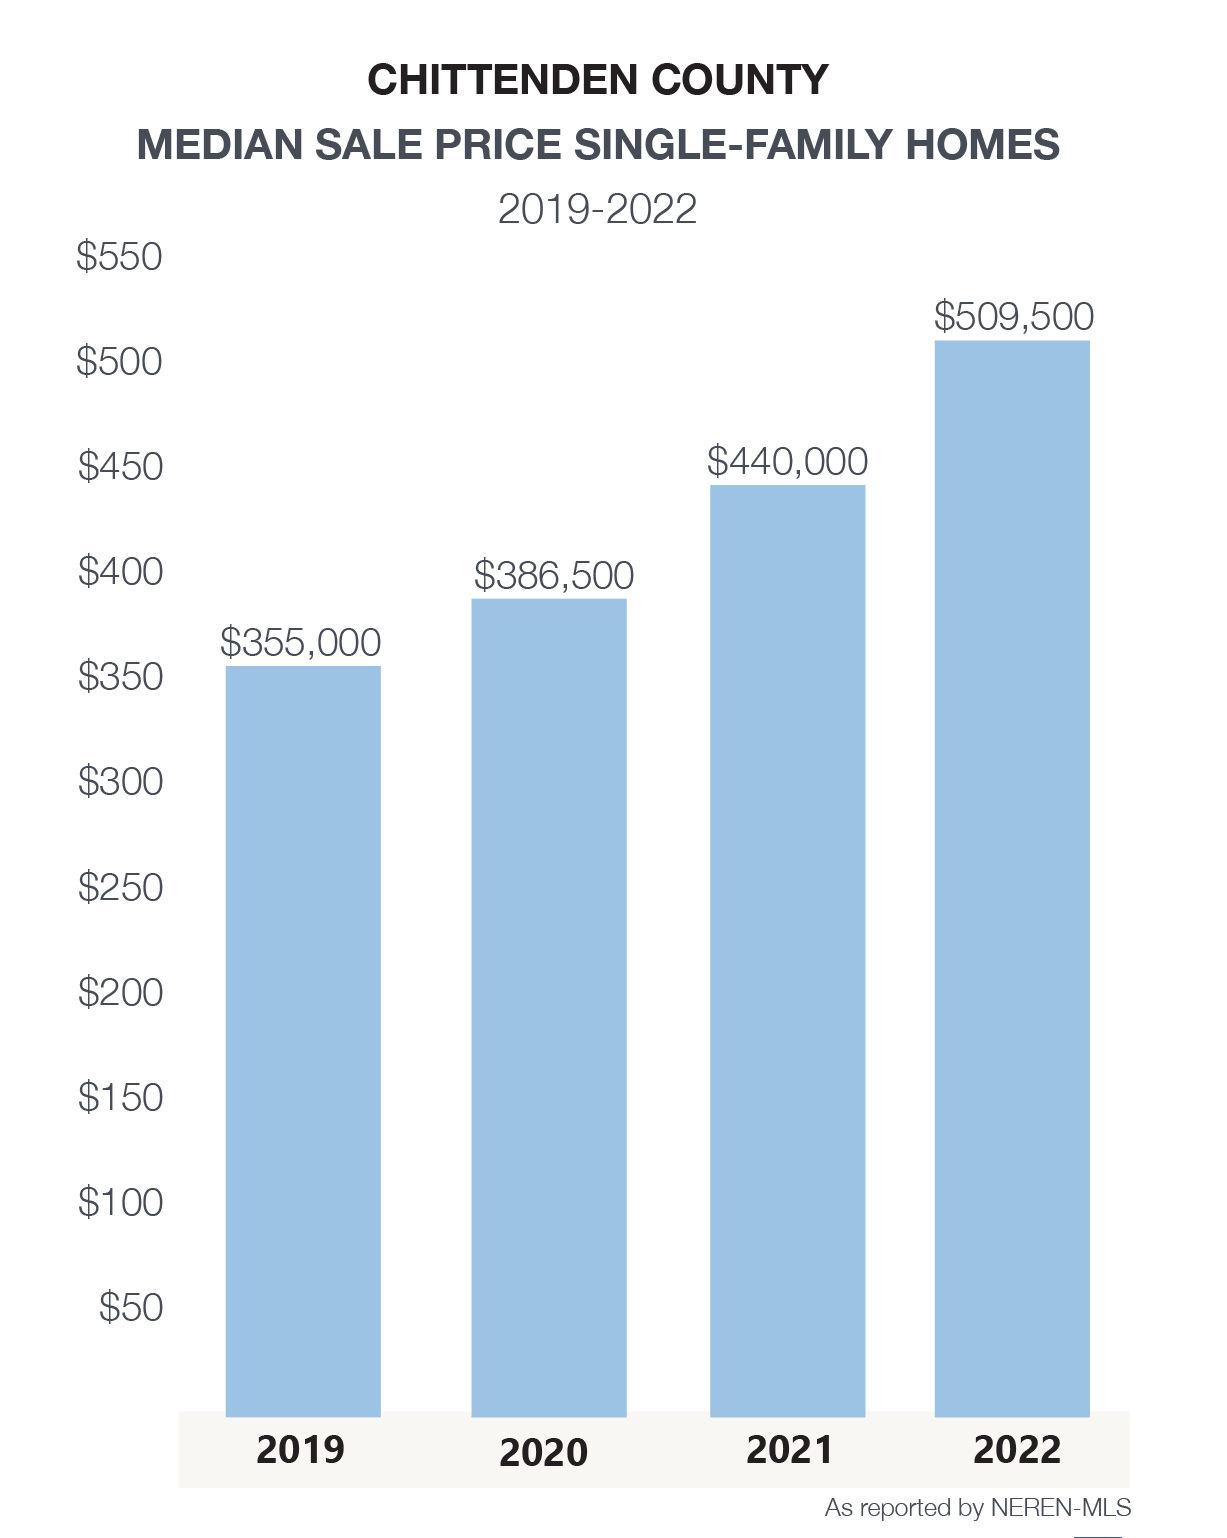
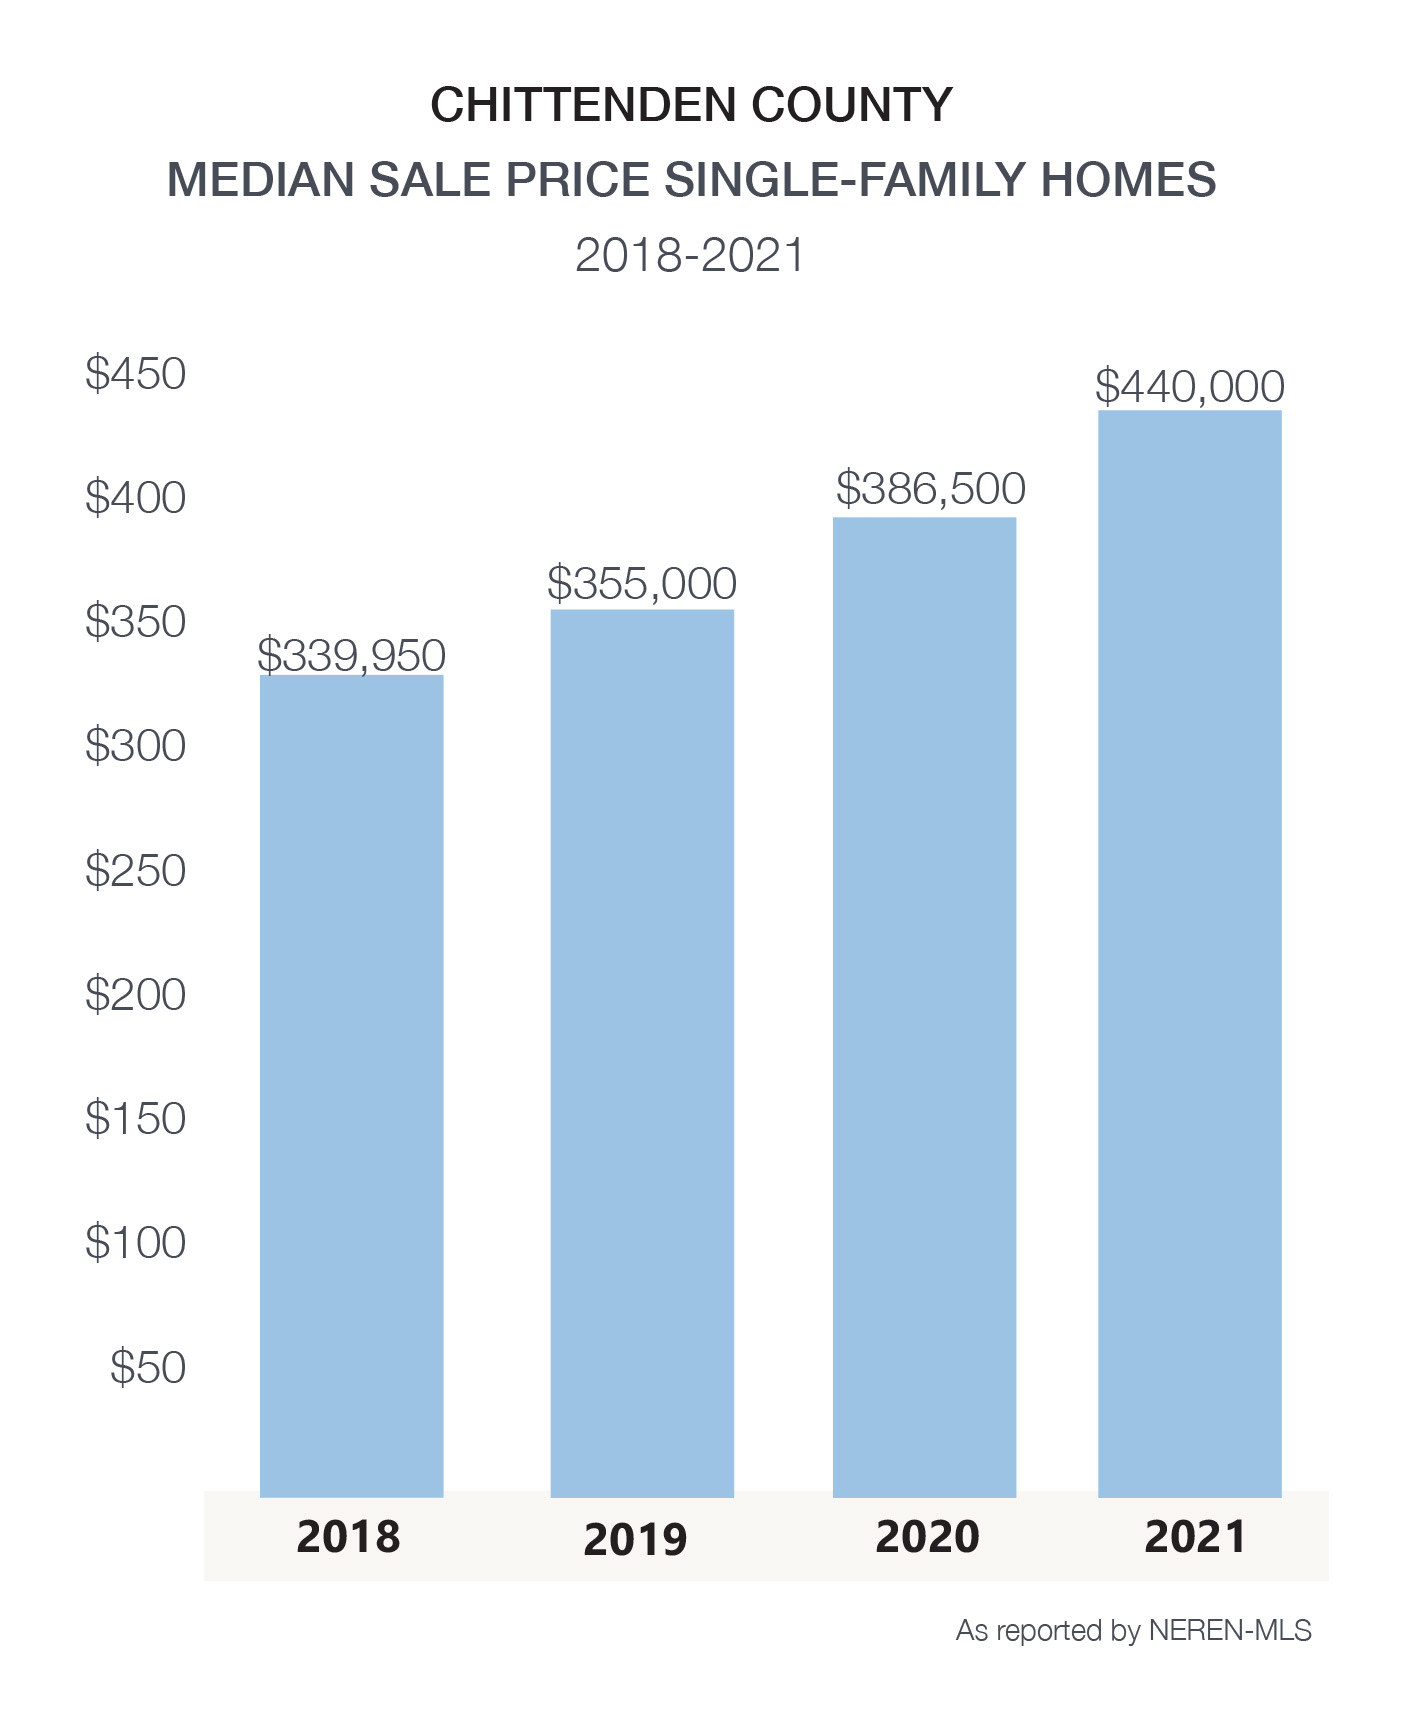
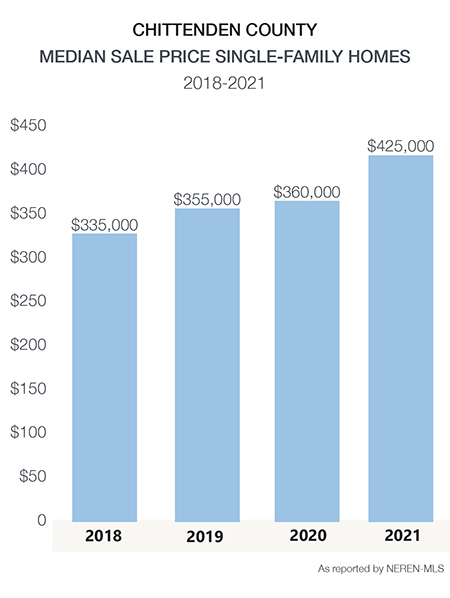
 While prices for single-family homes have increased across the county by 42% since 2020, growth has moderated in 2023 at a 7% increase. Homeowners have seen
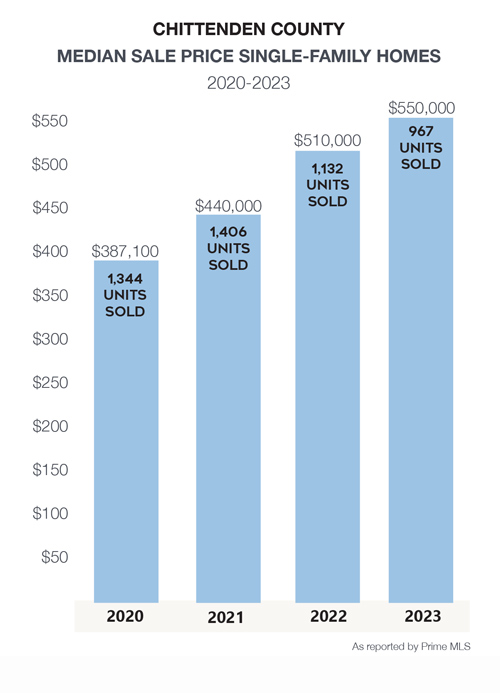
 While prices for single family homes have increased across the county by nearly 51% since mid-year 2020, growth has moderated in 2023 at a 7% increase. Homeowners have seen increased equity over the past few years, while benefiting as the largest portion of their living expenses – their mortgage – remained stable. Year to date, although buyer demand remained strong, a drop of 16% in new listings resulted in a decline in closed sales. Some buyers, many who paused searches in the second half of 2022 due to rising interest rates, have reentered the market this spring to face competitive offers. This is more frequent in the more affordable price ranges. The decline in new listings is also beginning to moderate as lifestyle factors encourage many sellers to maximize gains and make moves long delayed since the pandemic.