| Luxury Homes | |||
|---|---|---|---|
| Median Sale Price: | Units Sold: | Newly Listed | Days on Market: |
| $978,750 -1.1% | 8 -27.3% | 11 +83.3% | 144 -24.6% |
Early 2026 Market Report
| Luxury Homes | |||
|---|---|---|---|
| Median Sale Price: | Units Sold: | Newly Listed | Days on Market: |
| $978,750 -1.1% | 8 -27.3% | 11 +83.3% | 144 -24.6% |
| Single-Family Homes | ||||
|---|---|---|---|---|
| Median Sale Price: | Average Sale Price: | Units Sold: | Newly Listed: | Days on Market: |
| $219,500 -13.9% | $262,890 -3.5% | 20 -4.7% | 38 +11.8% | 118 -25.3% |
| MEDIAN SALE PRICE | VS 2018 | UNITS SOLD | VS 2018 | NEWLY LISTED | VS 2018 | DAYS ON MARKET | |
|---|---|---|---|---|---|---|---|
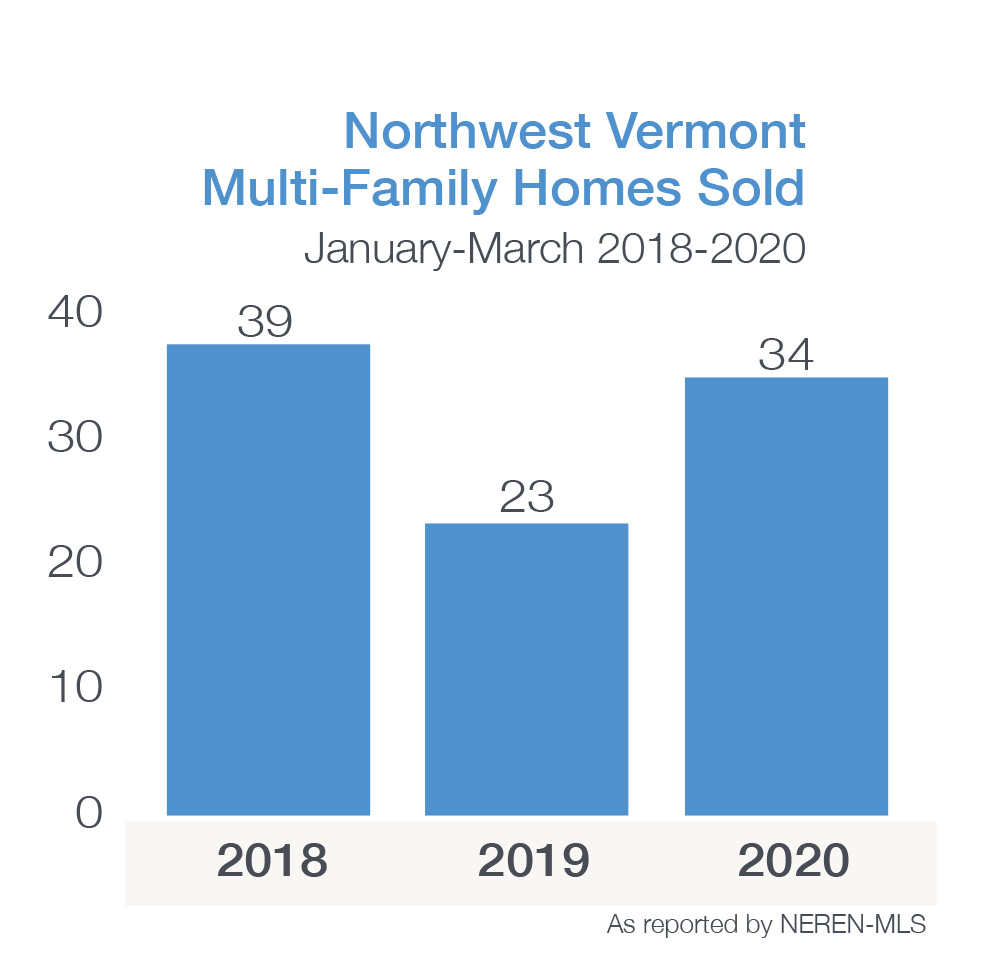
| All Counties Multi-Family | $377,765 | 19.90% | 34 | 47.80% | 33 | -43% | 92 |
| Chittenden County | $428,000 | -6.10% | 28 | 75.00% | 19 | -53.70% | 93 |
| Addison County | $180,000 | 20.00% | 1 | 0.00% | 2 | -33.30% | 57 |
| Franklin County | $159,000 | -24.60% | 5 | -16.70% | 12 | -7.70% | 93 |

| MEDIAN SALE PRICE | VS 2018 | UNITS SOLD | VS 2018 | NEWLY LISTED | VS 2018 | DAYS ON MARKET | |
|---|---|---|---|---|---|---|---|
| All Counties Land | $87,500 | -27.10% | 26 | -16.10% | 104 | 0% | 260 |
| Chittenden County | $208,000 | 73.30% | 9 | -30.80% | 26 | -23.53% | 211 |
| Addison County | $82,250 | -20.70% | 10 | 0.00% | 30 | 42.86% | 347 |
| Franklin County | $48,000 | -41.30% | 7 | 16.70% | 34 | -19.05% | 200 |
| Grand Isle County | - | - | - | - | 14 | 100% | - |
| Single Family | ||||
|---|---|---|---|---|
| Median Sale Price: | Average Sale Price: | Units Sold: | Newly Listed: | Days on Market: |
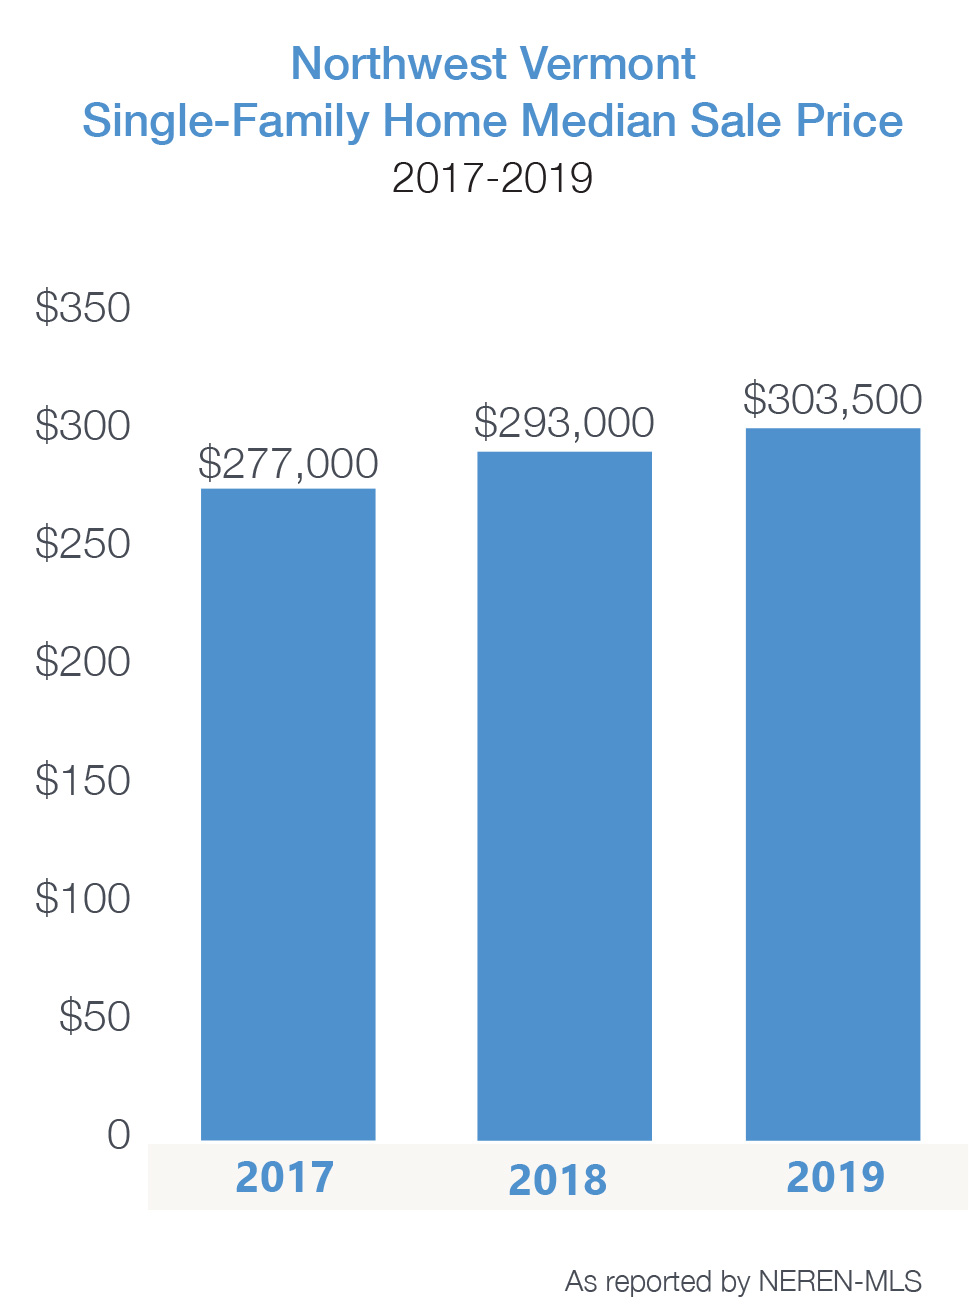
| $303,500 +3.6% | $345,361 +6.1% | 2,530 +11.3% | 3248 +4.9% | 73 -16.1% |
| Condo | ||||
|---|---|---|---|---|
| Median Sale Price: | Average Sale Price: | Units Sold: | Newly Listed: | Days on Market: |
| $245,000 +6.5% | $276,300 +6.4% | 756 -0.1% | 835 -6.9% | 65 -7.1% |
Last year at this time, we provided our recap of 2018 and projections for 2019 based upon analyst predictions for the national and local real estate market. Limited inventory of homes for sale remained the top story. The stock market was volatile; a government shut down impacted the economy and housing market for a short time; mortgage interest rates were projected to reach 5.25% by the end of 2019; and there was talk of a looming recession. Despite those predictions, 2019 was a strong year for real estate.
 While the supply of homes coming on the market remained lower than buyer demand, many parts of our region reflected an increase in inventory. The median sale price grew, enticing home owners to sell in order to maximize their equity. Interest rates dropped in 2019 by .75-1.0% points and will remain low in 2020 – likely somewhere between 3.7% and 3.9%.
With low mortgage rates, low unemployment, and continued wage growth, home buyer activity is expected to remain healthy in 2020.
Millennials, many saddled with heavy student loan debt, have made their mark on the real estate market after many years on the sidelines. At the start of 2019, Millennials accounted for 45% of home buyers. This group is expected to dominate the market again in 2020. Realtor.com expects millennials to make more than 50% of all home purchases in 2020. As home prices increase, Millennials look toward more affordable places to put down roots – namely smaller locales on the outskirts of cities and towns. This has led to the term “hipsturbia communities” – live-work-play communities. Vergennes and Bristol in Addison County & Winooski, Jericho and Hinesburg in Chittenden County are examples of towns with healthy increases in homes sold – perhaps as result of Millennials buyers entering the market.
 Baby Boomers, on the other end of the housing spectrum, are staying in their homes longer than ever; 10-13 years on average vs 7 years, historically. These home owners are willing to sell their large family homes but are having trouble finding new home that are right-sized, with easy maintenance so that they can enjoy the lifestyle they have worked so hard to achieve. Their large, family homes may not appeal to energy conscious Millennials also seeking life balance.
New construction projects play a key role in easing the inventory shortage, delivering homes that today’s buyers are looking for and stabilizing pricing. Builders face challenges in land, permit and materials cost as well as shortages in labor which puts the price of new homes in the area well above $400,000. Some communities are challenging new developments, with neighbors raising concerns about the loss of green space and wildlife habitats. The quality of life that draws people to Vermont needs to be carefully balanced with the cost of living in our beautiful state.
2020 will remain a seller’s market in most of the region, with a true buyer’s market not on the immediate horizon. Multiple offers on homes priced near the median for the market and located in sought after towns will continue through the year; however, conditions are favorable for real estate.
Buyers and sellers alike should have these best practices in mind: identify your wants and needs, learn about the market, form reasonable expectations, perform your due diligence, and be prepared to act – with the assistance of a skilled and trusted Realtor.
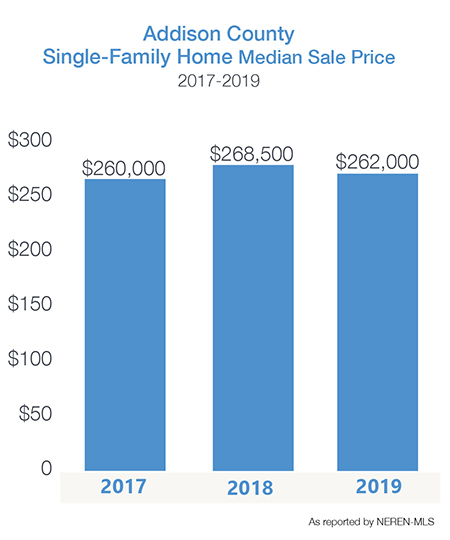
| Single Family | ||||
|---|---|---|---|---|
| Median Sale Price: | Average Sale Price: | Units Sold: | Newly Listed: | Days on Market: |
| $262,000 -2.4% | $299,352 +0.9% | 383 +10.1% | 506 -1.0% | 115 +1.8% |
| Condos | ||||
|---|---|---|---|---|
| Median Sale Price: | Average Sale Price: | Units Sold: | Newly Listed: | Days on Market: |
| $197,000 -5.7% | $229,759 +2.8% | 27 +58.8% | 28 +16.7% | 48 -22.6% |
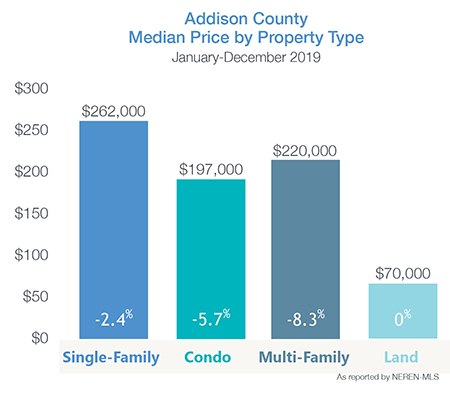
The number of single-family homes sold in 2019 jumped 10% in Addison County, while newly listed properties and sales prices remained stable. Condominium sales rose from 17 units in 2018 to 27 units in 2019. An increase in condos available fueled this growth along with more affordable price points and ease of maintenance.
 Buyers are attracted to the relative affordability compared to neighboring Chittenden County – along with the quaint Vermont feel of restaurants, galleries and small shops that make up the downtowns of many of the towns in Addison County.
Topping the list of closed sales in the county were Middlebury, Bristol, Ferrisburgh, and Vergennes.
 A 25% increase in homes available for purchase in Vergennes resulted in a 23% rise in single family homes sold through the year. Undoubtedly, Vergennes’ thriving downtown and proximity to Lake Champlain appeal to many buyers including Millennials searching for a work-play lifestyle.
Cornwall, Panton and Weybridge lead the county with the highest median sales price.
| Single-Family | MEDIAN SALE PRICE | VS 2018 | UNITS SOLD | VS 2018 | NEWLY LISTED | VS 2018 | DAYS ON MARKET |
|---|---|---|---|---|---|---|---|
| Addison County | $262,000 | -2.40% | 383 | 10.10% | 506 | -1.00% | 115 |
| Addison | $261,000 | -17.70% | 22 | 8333.00% | 28 | -6.70% | 213 |
| Bridport | $257,000 | -10.80% | 15 | 66.70% | 15 | -11.80% | 167 |
| Bristol | $260,000 | 8.50% | 31 | 10.70% | 40 | 17.70% | 87 |
| Cornwall | $428,500 | 7.50% | 14 | 40.00% | 12 | -50.00% | 217 |
| Ferrisburgh | $277,300 | -10.10% | 41 | 57.70% | 49 | 14.00% | 98 |
| Goshen | $133,868 | 0.00% | 4 | 0.00% | 7 | 16.70% | 146 |
| Granville | $340,000 | -20.00% | 5 | 66.70% | 5 | -28.60% | 175 |
| Hancock | $182,900 | 94.60% | 2 | -60.00% | 7 | 16.70% | 105 |
| Leicester | $192,000 | 9.10% | 15 | 150.00% | 29 | 163.60% | 88 |
| Lincoln | $204,000 | -18.70% | 17 | -5.60% | 23 | -20.70% | 149 |
| Middlebury | $285,500 | 2.90% | 72 | 4.40% | 89 | 12.70% | 70 |
| Monkton | $294,000 | -7.60% | 17 | -29.20% | 30 | -6.30% | 66 |
| New Haven | $301,750 | -9.40% | 10 | -33.30% | 14 | -33.30% | 144 |
| Orwell | $205,000 | -8.90% | 17 | 41.70% | 19 | -5.00% | 160 |
| Panton | $460,500 | 11.60% | 12 | 20.00% | 14 | -26.30% | 173 |
| Ripton | $197,500 | -7.60% | 6 | -25.00% | 7 | -46.20% | 161 |
| Salisbury | $365,000 | 43.10% | 12 | -20.00% | 21 | 0.00% | 163 |
| Shoreham | $207,450 | -24.60% | 16 | -5.90% | 24 | -14.30% | 146 |
| Starksboro | $247,000 | 3.50% | 12 | -33.30% | 17 | -19.10% | 54 |
| Vergennes | $222,500 | -5.00% | 32 | 23.10% | 40 | 25.00% | 60 |
| Waltham | $340,000 | 21.50% | 5 | 66.70% | 7 | 40.00% | 64 |
| Weybridge | $468,750 | 7.80% | 6 | -14.30% | 8 | 0.00% | 149 |
| Whiting | n/a | n/a | n/a | n/a | 1 | -80.00% | n/a |
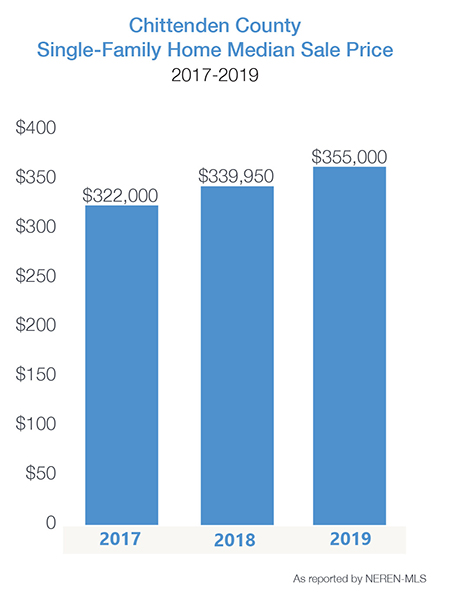
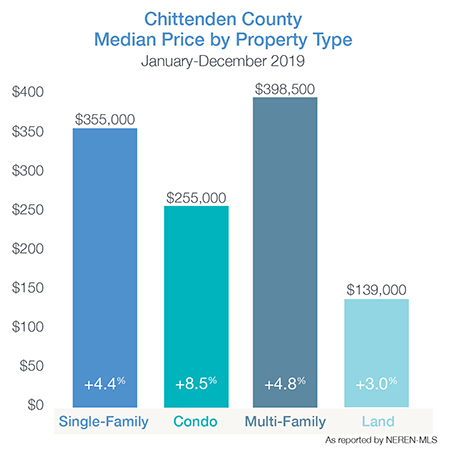
| Single-Family Homes | ||||
|---|---|---|---|---|
| Median Sale Price: | Average Sale Price: | Units Sold: | Newly Listed: | Days on Market: |
| $355,000 +4.4% | $408,623 +7.2% | 1403 +13.7% | 1720 +12.4% | 45 -27.4% |
| Condos | ||||
|---|---|---|---|---|
| Median Sale Price: | Average Sale Price: | Units Sold: | Newly Listed: | Days on Market: |
| $255,000 +8.5% | $283,855 +6.9% | 669 -0.9% | 738 -8.7% | 59 +1.7% |
The housing market remains hot in Chittenden County posting double digit gains in the number of single-family homes sold.
The 12% increase in homes listed during 2019 was quickly absorbed by the buyers in the market. With mortgage interest rates dropping in 2019, many new buyers entered the market after remaining on the sidelines. Multiple offers in key areas and price points, continued to push the median and average sale prices up. Shelburne, Charlotte and South Burlington posted the highest median prices in the county while Winooski, Bolton and Milton offered homes below the county median.
 Condominiums remain a more affordable option than single-family homes in Chittenden County. The 8.5% increase in median price may be a result of newly built condos, at higher prices, in addition to the normal affects of supply & demand. Ease of maintenance, the “right size” floorplans and energy efficiency of new condominiums are attractive to families and empty- nesters alike.
In South Burlington, Hillside at O’Brien Farm welcomed 23 new homeowners with 13 more awaiting their dream homes to be completed in 2020. South Village, off of Spear Street, may introduce the long-awaited Phase 3 of their “agri-hood” community. Additional new construction projects in Shelburne, Essex and Williston may ease the inventory shortage slightly.
 With “days on the market” (the time from listing to closing) at only 1.5 months, buyers must be well prepared to act fast with the assistance of their REALTOR if they want to achieve their dream of home ownership in 2020.
| Single-Family Homes | MEDIAN | VS 2018 | UNITS SOLD | VS 2018 | NEWLY LISTED | VS 2018 | DAYS ON MARKET | |
|---|---|---|---|---|---|---|---|---|
| Chittenden County | $355,000 | 4.40% | 1403 | 13.70% | 1720 | 12.40% | 45 | |
| Bolton | $282,500 | 2.00% | 10 | -23.10% | 11 | -31.30% | 66 | |
| Buels Gore | n/a | n/a | n/a | n/a | n/a | n/a | n/a | |
| Burlington | $347,000 | 2.40% | 218 | 23.90% | 260 | 27.50% | 36 | |
| Charlotte | $522,000 | 0.40% | 66 | 22.20% | 90 | 13.90% | 109 | |
| Colchester | $363,500 | 7.70% | 166 | 38.30% | 216 | 36.70% | 43 | |
| Essex | $339,950 | 6.20% | 202 | 9.20% | 239 | 4.80% | 35 | |
| Hinesburg | $349,000 | 1.80% | 51 | 30.80% | 51 | -15.00% | 57 | |
| Huntington | $325,500 | 14.30% | 24 | 26.30% | 21 | -32.30% | 50 | |
| Jericho | $385,000 | 4.10% | 69 | 30.20% | 86 | 30.30% | 38 | |
| Milton | $289,950 | 0.00% | 116 | 6.40% | 134 | 6.40% | 41 | |
| Richmond | $350,000 | 8.40% | 31 | 14.80% | 44 | 46.70% | 29 | |
| Shelburne | $597,500 | 51.50% | 76 | 10.10% | 88 | -3.30% | 54 | |
| South Burlington | $430,000 | 6.70% | 169 | -2.90% | 224 | 9.30% | 43 | |
| St. George | $434,393 | 36.80% | 8 | 14.30% | 11 | 37.50% | 120 | |
| Underhill | $326,500 | -18.30% | 36 | 5.90% | 50 | 31.60% | 35 | |
| Westford | $314,900 | 1.60% | 29 | 20.80% | 38 | 8.60% | 68 | |
| Williston | $397,000 | 5.90% | 84 | -5.60% | 108 | 2.90% | 45 | |
| Winooski | $266,750 | -5.20% | 48 | 20.00% | 49 | 0.00% | 27 |
| Condos | MEDIAN SALE PRICE | VS 2018 | UNITS SOLD | VS 2018 | NEWLY LISTED | VS 2018 | DAYS ON MARKET |
|---|---|---|---|---|---|---|---|
| Chittenden County | $255,000 | 8.50% | 669 | -0.90% | 738 | -8.70% | 59 |
| Bolton | $131,500 | 22.90% | 11 | -8.30% | 8 | -50.00% | 88 |
| Burlington | $268,500 | 2.70% | 106 | 5.00% | 129 | 17.30% | 46 |
| Charlotte | n/a | n/a | n/a | n/a | 1 | n/a | n/a |
| Colchester | $224,000 | 8.70% | 73 | 9.00% | 91 | 5.80% | 48 |
| Essex | $247,450 | 21.90% | 138 | 7.80% | 139 | -17.80% | 58 |
| Hinesburg | $272,450 | 71.60% | 8 | 0.00% | 7 | -36.40% | 201 |
| Jericho | $291,357 | 24.00% | 11 | 57.10% | 10 | 66.70% | 64 |
| Milton | $213,725 | 6.90% | 28 | 33.30% | 31 | 0.00% | 69 |
| Richmond | $212,000 | -29.30% | 3 | 50.00% | 3 | 0.00% | 60 |
| Shelburne | $375,000 | 31.60% | 23 | 15.00% | 34 | 47.80% | 45 |
| South Burlington | $241,000 | 3.90% | 183 | -10.70% | 210 | -9.90% | 55 |
| Underhill | n/a | n/a | n/a | n/a | n/a | n/a | n/a |
| Williston | $320,530 | 3.10% | 73 | -9.90% | 63 | -35.10% | 79 |
| Winooski | $250,000 | -15.30% | 12 | -47.80% | 12 | -47.80% | 86 |
| Single Family | ||||
|---|---|---|---|---|
| Median Sale Price: | Average Sale Price: | Units Sold: | Newly Listed: | Days on Market: |
| $233,500 +11.8% | $233,234 +7.6% | 595 +6.6% | 796 0.0% | 97 -6.7% |
| Condos | ||||
|---|---|---|---|---|
| Median Sale Price: | Average Sale Price: | Units Sold: | Newly Listed: | Days on Market: |
| $195,000 +4.0% | $210,741 +1.7% | 58 -9.4% | 67 +4.7% | 134 -34.6% |
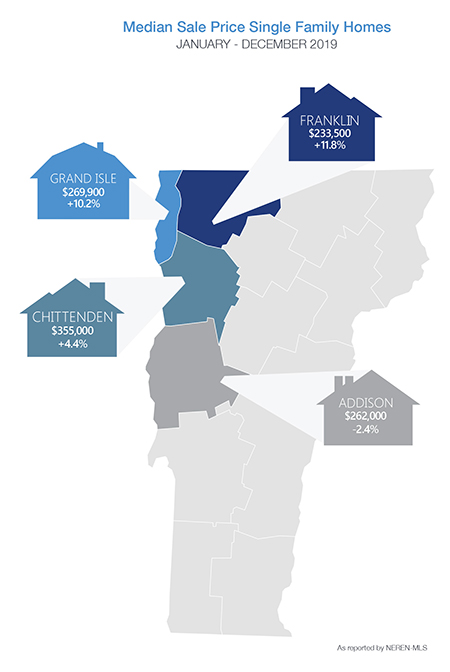
 The most affordable county in northwest Vermont – Franklin County continues to draw buyers and investors seeking home ownership options. Town by town data varies widely with median prices and sales fluctuating based upon proximity to interstate 89, Lake Champlain or in second home areas.
 Accounting for nearly half the sales in the county, St. Albans and Swanton, together, posted healthy improvements in the median sales price after slight declines in 2018. Fairfax and Fletcher continue to thrive with the number of closed sales increasing year after year.
| Single-Family Homes | MEDIAN SALE PRICE | VS 2018 | UNITS SOLD | VS 2018 | NEWLY LISTED | VS 2018 | DAYS ON MARKET |
|---|---|---|---|---|---|---|---|
| Franklin County | $233,500 | 11.80% | 595 | 6.60% | 796 | 0.00% | 97 |
| Bakersfield | $162,250 | -14.10% | 16 | 33.30% | 25 | 66.70% | 56 |
| Berkshire | $187,000 | 41.10% | 11 | 10.00% | 19 | 26.70% | 120 |
| Enosburg | $179,000 | 15.50% | 23 | -8.00% | 38 | -13.60% | 136 |
| Fairfax | $302,000 | 5.60% | 70 | 11.10% | 88 | -3.30% | 68 |
| Fairfield | $293,000 | 39.50% | 15 | 0.00% | 25 | 8.70% | 90 |
| Fletcher | $264,000 | 6.90% | 24 | 26.30% | 27 | -3.60% | 107 |
| Franklin | $168,000 | 4.40% | 15 | 150.00% | 27 | 22.70% | 162 |
| Georgia | $263,500 | -5.90% | 50 | 13.60% | 61 | 0.00% | 85 |
| Highgate | $222,500 | 23.30% | 26 | -35.00% | 47 | -4.10% | 106 |
| Montgomery | $155,000 | -23.50% | 18 | -5.30% | 30 | 42.90% | 150 |
| Richford | $117,500 | 26.30% | 35 | 12.90% | 44 | -20.00% | 191 |
| Sheldon | $200,000 | 9.00% | 29 | 7.40% | 36 | 9.10% | 57 |
| St. Albans | $242,000 | 16.90% | 163 | 8.00% | 200 | -3.90% | 98 |
| Swanton | $229,000 | 14.50% | 100 | 4.20% | 129 | -1.50% | 75 |
| Single Family | ||||
|---|---|---|---|---|
| Median Sale Price: | Average Sale Price: | Units Sold: | Newly Listed: | Days on Market: |
| $269,900 +10.2% | $315,690 -7.7% | 149 +12.0% | 226 -12.7% | 131 -22.5% |
| Condos | ||||
|---|---|---|---|---|
| Median Sale Price: | Average Sale Price: | Units Sold: | Newly Listed: | Days on Market: |
| $278,500 +8.0% | $278,500 +7.5% | 2 +100% | 2 +100% | 67 -14.1% |
 The number of homes sold throughout Grand Isle County rebounded in 2019 after a decline in 2018. The natural confines of the islands geography coupled with development and permitting restrictions naturally limits growth in the county. With the smallest number of sales and inventory available throughout the 4 counties in this report, Grand Isle County statistics can vary widely from season to season.
5 home sales, over $850,000, are included in the Luxury section of the report. This is down from 10 sales in 2018 which undoubtedly affected the average sale price in the county.
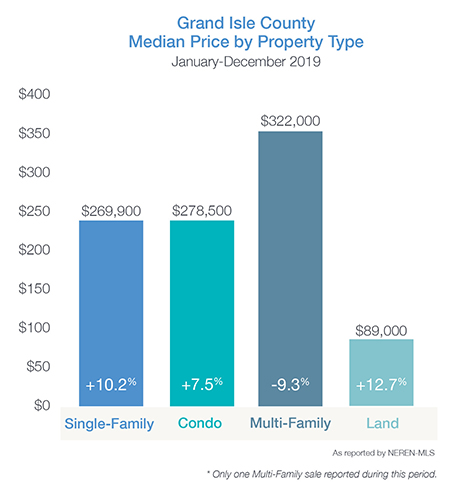 Savvy buyers seek the county’s access to Lake Champlain, Interstate 89 – and substantially lower property taxes than luxury, lakefront homes to the south.
| Single-Family Homes | MEDIAN SALE PRICE | VS 2018 | UNITS SOLD | VS 2018 | NEWLY LISTED | VS 2018 | DAYS ON MARKET |
|---|---|---|---|---|---|---|---|
| Grand Isle County | $269,900 | 10.20% | 149 | 12.00% | 226 | -12.70% | 131 |
| Alburgh | $155,500 | -6.60% | 40 | 11.10% | 74 | -7.50% | 129 |
| Grand Isle | $283,750 | 15.10% | 42 | 10.50% | 47 | -13.00% | 148 |
| Isle La Motte | $235,000 | 5.90% | 9 | 50.00% | 25 | 4.20% | 154 |
| North Hero | $279,900 | 6.70% | 31 | 29.20% | 46 | -24.60% | 83 |
| South Hero | $380,000 | 5.60% | 27 | -6.90% | 34 | -15.00% | 157 |

| Luxury Homes | |||
|---|---|---|---|
| Median Sale Price: | Units Sold: | Newly Listed | Days on Market: |
| $968,000 -5.7% | 66 +26.9% | 113 -5.8%) | 123 -15.2% |
Luxury Home sales, defined as $850,000 and above, in Northwest Vermont have continued to grow increasing 32% since 2016.
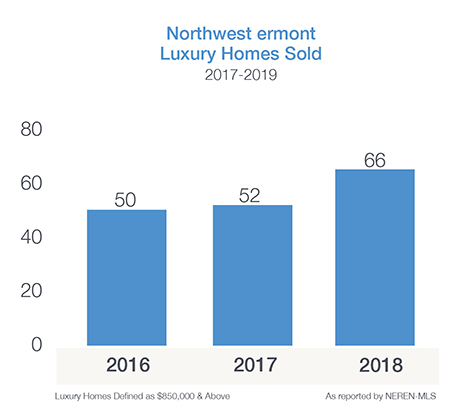 Nationally, the luxury market has slowed, but Vermont remains one of the most affordable luxury home markets in New England – which may be bolstering sales here. Local lenders report that Jumbo loans remain remarkably competitive offering favorable options for luxury home buyers, as well.
In Chittenden County, 49 luxury sales were closed, including homes in downtown Burlington, on spacious lots with views in Shelburne & Charlotte, along the popular Spear Street in South Burlington, as well as on the Lake Champlain shoreline.
Luxury sales of country homes in Addison County and lakefront homes in Grand Isle County rounded out the luxury market for 2019.
Many homes in the luxury category went “under contract” within just days of coming on the market demonstrating pent-up demand of buyers waiting for a home in the right location offering the the right amenities. The average “days on market” of 123 days is inflated by some of the special properties on the upper end of the market.
| Address | Town | County | Sale Price |
|---|---|---|---|
| 308 South Prospect Street | Burlington | Chittenden | $850,000 |
| 2952 Greenbush Road | Charlotte | Chittenden | $850,000 |
| 35 Cherry Street | Burlington | Chittenden | $850,000 |
| 258 Summer Point Lane | Ferrisburgh | Addison | $850,000 |
| 33 Burke Road | Orwell | Addison | $850,000 |
| 197 Pease Mountain Road | Charlotte | Chittenden | $855,000 |
| 8 Hall Road | South Hero | Grand Isle | $862,000 |
| 2385 Shelburne Falls Road | Hinesburg | Chittenden | $862,500 |
| 345 Morgan Drive | Shelburne | Chittenden | $870,000 |
| 25 Bayview Street | Burlington | Chittenden | $880,000 |
| 1723 Marble Island Road | Colchester | Chittenden | $880,000 |
| 51 Muddy Dog Run | Westford | Chittenden | $890,000 |
| 1567 Morgan Horse Farm Road | Weybridge | Addison | $890,000 |
| 622 Ridgefield Road | Shelburne | Chittenden | $892,500 |
| 338 Golf Course Road | South Burlington | Chittenden | $900,000 |
| 345 Meadowridge Road | Williston | Chittenden | $900,000 |
| 6 Park Road | South Burlington | Chittenden | $908,500 |
| 404 Staton Drive | Panton | Addison | $910,850 |
| 1406 Spear Street | South Burlington | Chittenden | $920,000 |
| 1490 Arnold Bay Road | Panton | Addison | $939,000 |
| 5520 Sand Road | Ferrisburgh | Addison | $939,000 |
| 127 Prindle Road | Charlotte | Chittenden | $945,000 |
| 263 Golf Course Road | South Burlington | Chittenden | $945,000 |
| 108 Brigham Hill Road | Essex | Chittenden | $949,000 |
| 203 Nobles Hill Road | Isle La Motte | Grand Isle | $950,000 |
| 4 Fairholt Drive | Burlington | Chittenden | $950,000 |
| 282 Clearwater Road | Shelburne | Chittenden | $950,000 |
| 480 Staton Drive | Panton | Addison | $961,000 |
| 161 Deforest Road | Burlington | Chittenden | $975,000 |
| 366 Black Willow Lane | Charlotte | Chittenden | $989,000 |
| 146 Simmons Drive | Shelburne | Chittenden | $990,000 |
| 35 Edgewood Road | Cornwall | Addison | $1,000,000 |
| 608 Hills Point Road | Charlotte | Chittenden | $1,015,000 |
| 1397 Spear Street | South Burlington | Chittenden | $1,030,000 |
| 582 Autumn Hill Lane | Shelburne | Chittenden | $1,040,000 |
| 7 Surf Road | Burlington | Chittenden | $1,050,000 |
| 33 East Shore North Road | Grand Isle | Grand Isle | $1,080,000 |
| 3412 Harbor Road | Shelburne | Chittenden | $1,100,000 |
| 11 Adams Landing Extension | Grand Isle | Grand Isle | $1,125,000 |
| 3410 Harbor Road | Shelburne | Chittenden | $1,125,000 |
| 265 Buff Ledge Road | Colchester | Chittenden | $1,136,500 |
| 6135 Mt. Philo Road | Charlotte | Chittenden | $1,150,000 |
| 274 Pine Haven Shores Lane | Shelburne | Chittenden | $1,150,000 |
| 358 Golf Course Road | South Burlington | Chittenden | $1,150,358 |
| 293 Mead Farm Road | Hinesburg | Chittenden | $1,200,000 |
| 24 Sunset Cliff Road | Burlington | Chittenden | $1,200,000 |
| 289 Upper Old Town Trail | Charlotte | Chittenden | $1,250,000 |
| 294 Pine Haven Shores Lane | Shelburne | Chittenden | $1,250,000 |
| 1283 Cheesefactory Road | Shelburne | Chittenden | $1,400,000 |
| 40 College Street | Burlington | Chittenden | $1,400,000 |
| 793 Orchard Road | Charlotte | Chittenden | $1,530,000 |
| 301 West Shore Road | South Hero | Grand Isle | $1,625,000 |
| 1400 Spear Street | South Burlington | Chittenden | $1,650,000 |
| 321 Crooked Creek Road | Colchester | Chittenden | $1,750,000 |
| 1054 Sherman Hollow | Hinesburg | Chittenden | $1,775,000 |
| 96 Cliff Street | Burlington | Chittenden | $1,925,000 |
| 147 Appletree Point Road | Burlington | Chittenden | $2,185,000 |
| 252 Windmill Bay Road | Shelburne | Chittenden | $2,500,000 |
| 3611 Harbor Road | Shelburne | Chittenden | $2,681,000 |
| 222 Deer Point Road | Charlotte | Chittenden | $3,300,000 |
| 311 Whalley Road | Charlotte | Chittenden | $3,540,000 |
| 203 Pheasant Hill Lane | Shelburne | Chittenden | $3,710,000 |