The 2025 land market across Northwest and Central Vermont is measured and selective. It continued to cool from its pandemic-era peak, settling into a slower, more discerning environment. Across the five counties, the median land price dipped slightly to $140,000, while sales activity edged up modestly. Inventory increased, and days on market stretched further, underscoring a shift toward patient buyers who are carefully weighing development costs, permitting hurdles, and long-term use. This is a market segment driven by practicality, zoning realities, and site-specific value.
Land
MEDIAN SALE PRICE
VS 2024
UNITS SOLD
VS 2024
NEWLY LISTED
VS 2024
DAYS ON MARKET
VS 2024
Northwest & Central Vermont
$140,000
-5.40%
233
3.60%
470
6.80%
117
10%
Chittenden County
$241,000
7.10%
46
2.20%
88
-6.40%
99
22.20%
Addison County
$138,750
16.10%
38
-20.80%
96
28.00%
111
9.90%
Franklin County
$100,000
11.10%
49
14.00%
108
4.90%
167
32.50%
Grand Isle County
$97,500
8.30%
20
-13.00%
41
-6.80%
125
-33.90%
Washington County
$112,500
-22.40%
80
21.20%
137
10.50%
98
18.10%
Chittenden County proved to be the strongest and most resilient land market. Prices increased again, supported by limited supply, development pressure, and long-term housing demand. Well-located parcels remain competitive. Washington County was one of the most active land markets by volume, but pricing declined noticeably.
Buyers here are cost-conscious and factoring in site work, access, and infrastructure. In Addison County, prices rose modestly, though fewer parcels sold. Buyers are deliberate, often focused on residential or small-scale agricultural use. Active but price-sensitive, Franklin County land sales increased, but longer days on market point to buyers pushing harder on value especially for raw or remote land.
Demand remains for land in Vermont, but it has become more thoughtful. Successful outcomes depend on understanding local zoning, development feasibility, and true end-use potential making local expertise and realistic expectations critical on both sides of the transaction.
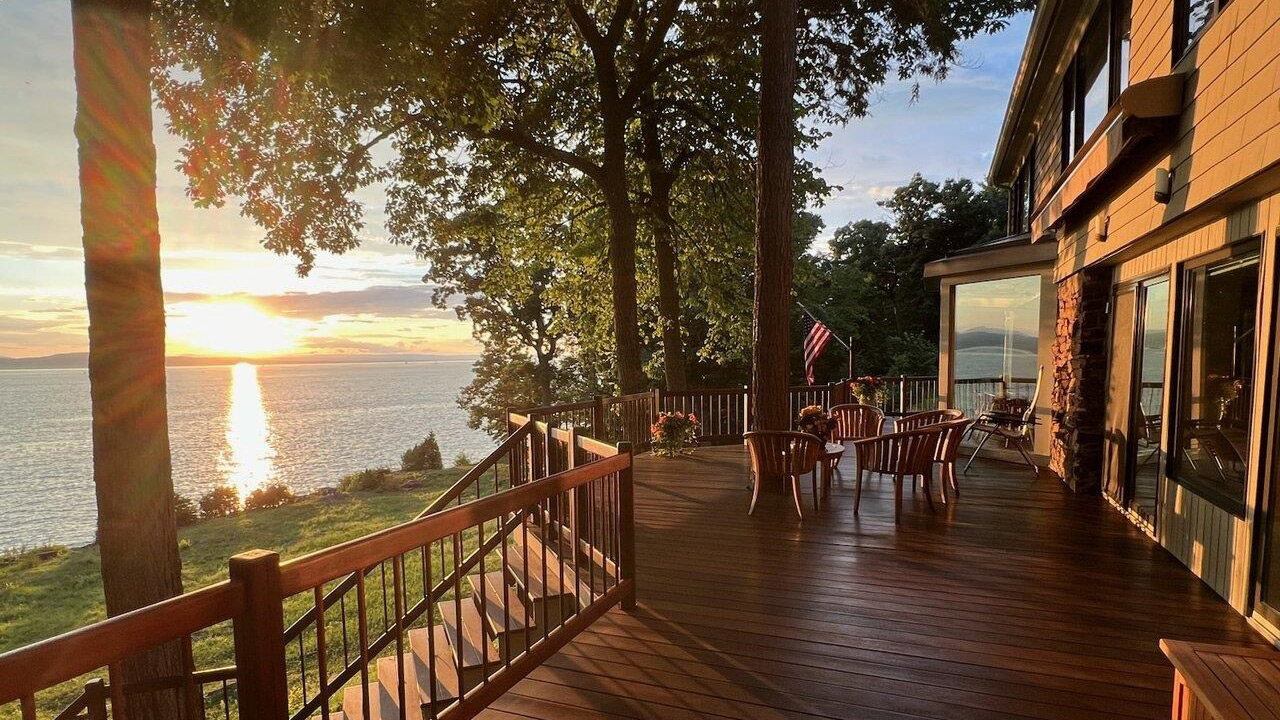
225 Eagles Rest Road, Shelburne, VT ~ This priceless Lake Champlain legacy waterfront home is a timeless masterpiece nestled on 12 private acres with approximately 830 feet of Shelburne Point waterfront – including an extraordinary 450 feet of rare sandy beach.
Both the U.S. and Vermont real estate markets are exhibiting stability and signs of long-term health. While some local markets are seeing slight price corrections due to rising inventory and more balanced supply/demand dynamics, these shifts are part of a necessary and sustainable market normalization.
Single-Family January-June 2025
Median Sale Price:
Average Sale Price:
Units Sold:
Newly Listed:
Days on Market:
$500,000 | 5.3%
$571,265 | 3.1%
1,005 | 8.9%
1,723 | 20.1%
43 | 4.9%
Condos January-June 2025
Median Sale Price:
Average Sale Price:
Units Sold:
Newly Listed:
Days on Market:
$370,000 | 7.3%
$407,904 | 3.2%
305 | -10.8%
494 | -0.2%
42 | 90.9%
At the national level, housing experts remain optimistic. According to the latest Home Price Expectations Survey from Fannie Mae, over 100 leading economists and analysts predict that home prices will continue to rise over the next five years, averaging 3.3% annual appreciation through 2029. Even the most conservative projections still forecast annual gains of 1.3%, while optimists expect growth closer to 5%. Crucially, no group surveyed anticipates a decline in national home values, thanks to factors such as low foreclosure rates, stable lending, and near-record levels of homeowner equity.
Mortgage rates remain a headwind for many buyers, but the pressure is easing. The average 30-year fixed mortgage rate now stands at 6.72%, down 17 basis points from this time last year. This modest shift has spurred a meaningful rebound in buyer activity: purchase applications are up 25%. As mortgage rates continue a gradual downward trend, buyer confidence appears to be strengthening across many regions. Most consumers now accept that mortgage rates will not return to the historically low 3.0-4.0% range.Learn more about local mortgage trends from Union Bank.
Inventory is also improving nationally. While some seasonal dips have occurred—particularly around the July 4th holiday—the overall trend is upward. New listings are increasing, and price reductions are becoming more common, a sign that sellers are adjusting expectations in response to rising competition and elevated borrowing costs. At the same time, homeowner equity remains a powerful market stabilizer. More than 82% of U.S. homeowners have at least 30% equity, and the national loan-to-value ratio is at a low 46.9%. In Vermont, over 85% of homeowners are equity rich, meaning they have at least 50% equity in their property; making sellers well positioned for their next move. With the majority of homeowners locked into long-term, fixed-rate loans and experiencing wage growth, there’s little pressure to sell under duress.
What are the latest market trends in Vermont real estate?
In Vermont, the market reflects many of these national patterns but also exhibits some unique local dynamics. In northwest and central Vermont, the median sale price for single-family homes has climbed to $500,000, a 5.26% increase from last year. This marks a continuation of an eight-year trend that has seen prices rise nearly 89% since 2017. Sales volume is also up, with 1,005 homes sold so far this year—a 9% increase over 2024. Homes are taking slightly longer to sell, with the average days on market rising to 43, indicating a return to more thoughtful, less hurried decision-making among buyers.
Theluxury real estate market across the United States and in Vermont is evolving into a more balanced, strategic space where buyers are discerning, sellers must be thoughtful, and opportunities are still available.
Despite global economic uncertainty, the upper tier of the housing market is proving its resilience—fueled by equity gains, wealth preservation strategies, and shifting generational demand. The multi-family sector is the standout performer in Vermont, with median sale prices up 26.9% and average sale prices up over 33%. Units sold are up nearly 28%, fueled by investor activity and demand for flexible housing options. Condo prices also rose (up 7.25%), though the number of units sold declined, potentially due to supply limitations or shifting affordability. Theland segmentsaw an 8% decline in median sale price, yet sales still rose by 3.57%, highlighting continued interest in development opportunities.
Buyers in Vermont, like their national counterparts, are gaining more time to explore and negotiate. Inventory is expanding, with new listings for single-family homes up 20%, and sellers are responding by pricing more strategically. The high equity environment and steady wage growth among Vermont homeowners offers a strong financial foundation that helps maintain market confidence.
Coldwell Banker Hickok & Boardman ranked the #1 Real Estate Company in the State of Vermont according to PrimeMLS
Last week, mortgage rates dropped to their lowest point in the past year—great news for buyers excited about the potential monthly savings reflected in their cost estimates. While rates have edged up slightly since the Federal Reserve’s Wednesday 9/17 announcement of a .25% cut in the Fed Funds rate, we’re still seeing many 30-year fixed scenarios in the high 5% range. This is a strong motivator as we head into what’s shaping up to be a busy autumn market.
Looking ahead, the Fed continues to project further reductions to the Federal Funds Rate through the end of 2025 and into 2026. The rate, which banks charge each other for overnight lending, is expected to fall to between 3.5% and 3.75%—down from today’s 4.0%–4.25% range. While mortgage rates aren’t directly tied to the Fed Funds Rate, this forecast does create downward pressure on mortgage rates over time.
Inflation remains above the Fed’s 2% target, and with continued uncertainty around both inflation and employment trends, the Fed is proceeding cautiously. While further rate cuts are likely, they are not guaranteed—making now a strategic time to buy or sell.
Waiting for significantly lower mortgage rates could be risky. A sharp drop might spark increased competition, making it more difficult for buyers to get their offers accepted. It’s a good reminder to share with your buyers: refinancing later is always an option—but securing the right home now is key.
Rates at today’s levels haven’t been seen in over a year. With less competition and more inventory coming to market, activity is expected to rise.
As always, your Spruce representative is here to answer questions or help you explore specific scenarios. Don’t hesitate to reach out—we’re here to support you!
This material may not be copied, reproduced, or distributed without proper credit to the authors Buddy Singh NMLS 92046 and Julie Thorpe NMLS 92216/ Spruce Mortgage NMLS 49592
Land sales in northwest and central Vermont remained resilient so far in 2025, despite downward pressure on prices. Across the counties, the median sale price of land declined 8.14% to $141,000, while the average sale price dropped sharply by 33.65% to $183,952. This significant dip in average pricing suggests fewer premium parcels sold this year. Nonetheless, 116 land parcels were sold, marking a slight 3.57% increase in activity compared to 2024. The pace of the market has slowed slightly, with average days on market (DOM) rising to 134 days, up 8%.
At the county level, Chittenden County retained the highest land values, with a median sale price of $250,000—up 11% year-over-year—and 25 parcels sold, a healthy 8.7% increase. In contrast, Addison County experienced a significant slowdown in both volume and pace: sales fell 29%, even as the median price rose to $145,000. Franklin County saw a 31.6% jump in unit sales, despite a modest 1% drop in median sale price, showing growing buyer interest in more affordable parcels. Washington County recorded the highest sales volume, with 38 parcels sold, but also experienced the steepest pricing drop—median sales price down 26%, and the average sales price down 62%. Meanwhile, Lamoille County posted the region’s highest price appreciation, with a median sales price jump of 36% to $120,000, even though the number of parcels sold dipped slightly.
Looking at historical context, 2025’s median sale price of land at $141,000 remains well above pre-pandemic levels (the median was just $76,500 in 2017). While sales volumes are far below the 2021 pandemic peak of 274 units, they have stabilized in recent years. The rising number of new listings (+9.6%) signals growing seller confidence and may offer buyers more negotiating room in the months ahead. Despite overall pricing volatility, land remains an attractive option for buyers seeking custom builds, especially as home inventory remains tight in many Vermont towns.
As we pass the midpoint of 2025, the Vermont housing market continues to navigate a complex and rapidly evolving landscape. While affordability and housing availability remain front and center, new challenges—and a few encouraging opportunities—are shaping this year’s outlook.
Despite rising interest rates, Vermont homeowners continue to lead the nation in home equity strength. Nationally, equity withdrawals surged 22% year over year, reaching nearly $25 billion in Q1—the largest such figure in 17 years. These withdrawals highlight the significant wealth Vermonters have tied up in their homes.
Mortgage interest rates are expected to decline modestly in the second half of 2025, likely averaging in the mid-to-upper 6% range for a 30-year fixed mortgage. This depends on potential Federal Reserve rate cuts, with September as a likely starting point. However, rates remain sensitive to inflation and economic data.
Housing Affordability
Vermont is addressing affordability with a range of mortgage programs. Local lenders like Union Bank consistently rank as top VHFA partners, and innovative tools like the LendTogether shared equity program aim to further improve access.
According to the U.S. Census Bureau, 820 permits were issued as of May 2025, down from 1,036 in May 2024. Despite fewer permits, Union Bank continues to report healthy construction lending.
As of mid-June, Freddie Mac reports the average 30-year mortgage rate at 6.81%, slightly lower than this time last year. Though affordability remains strained, 809 new housing units were authorized through April, signaling modest growth in construction activity.
Beware of the Rise of Title Pirates
Scammers are targeting unoccupied land and mortgage-free properties, fraudulently listing them for sale. Warning signs include:
Communication only by email
Refusal to meet in person
Cash-only demands
No in-person notary
Awareness is critical to stopping these fraudulent practices.
Looking Ahead
While obstacles remain, demand for mortgage and construction financing remains strong. Union Bank continues to offer local insight, trusted guidance, and tailored solutions to help communities thrive—regardless of market conditions.
25 Oakledge Drive, Burlington, VT – This home offers breathtaking views of Lake Champlain, the Adirondack Mountains, and Shelburne Point from nearly every room, creating a perfect blend of privacy, natural beauty, and urban convenience.
Nationally, luxury home prices remain strong.Median sold prices for single-family luxury homes increased 1.8% year-over-year, while attached properties (such as high-end condos and townhomes) saw 8.4% year-over-year growth, and an impressive 16.5% jump over 2023. This is largely driven by continued demand in major urban markets like New York City and Los Angeles, where trophy properties remain coveted.
Luxury inventory has climbed to a two-year high, with single-family listings up 40% since last year. This increase in supply reflects growing seller confidence and improved market conditions. Yet, despite more listings, high-quality properties continue to sell at strong prices—proof that buyers remain active, and values are holding firm.
A shift in buyer behavior is also shaping today’s market. A “tale of two luxury buyers” is emerging:
The no-compromise buyer, willing to pay a premium for turnkey, best-in-class properties.
The value-oriented buyer, more focused on long-term investment potential, location trade-offs, or renovation opportunities.
Luxury real estate is increasingly viewed as a cornerstone of wealth protection. According to Luxury Property Specialists surveyed, 68% of clients are maintaining or increasing their real estate investments, and even more are making all-cash purchases—highlighting the role of real estate as a hedge against market volatility.
Looking ahead, practicality is expected to outweigh lifestyle-driven splurges.Economic uncertainty is prompting buyers to refocus on tax strategies, liquidity, and long-term value. Also contributing to future growth is the 47% jump in U.S. home prices over the past five years, which has created trillions in equity—ushering in a new generation of move-up buyers entering the luxury tier. Millennials and Gen Z are making a stronger impact, seeking modern features like sustainability, turnkey convenience, and smart home technology.
Vermont’s luxury market…is reflecting many of the national trends, but with a distinctly regional character. While prices have corrected slightly, buyer activity was strong during the first half of the year, revealing underlying demand and greater market depth.
As of mid-2025, the median luxury home price across northwest and central Vermont is $1,512,500, a decrease of 8% year-over-year. The average sale price also fell 28.7%, likely due to a broader mix of properties entering the market, and more negotiated deals. However, this price shift did not deter buyers—luxury home sales are up 50%, with 42 units sold so far in 2025, the highest on record for the region.
In northwest Vermont, Chittenden County remains a luxury leader, accounting for 28 of the 42 sales. Lamoille County saw remarkable activity as well, with 126 transactions, reflecting the appeal of resort and second-home destinations like Stowe. Addison County posted the highest median sale price at $3.2 million, although this was based on very limited volume.
The days on market for luxury homes jumped to 83 days, up significantly from last year, signaling a shift in pace. Buyers are taking more time to evaluate options, and sellers must now emphasize presentation, pricing, and condition more than ever. Inventory is somewhat limited in certain counties, with new luxury listings down overall by 50%, making well-positioned homes even more attractive.
Proven Strength: Our market share reflects consistent performance across the luxury market, reinforcing the confidence high-end buyers and sellers have in our company and brand.
103 Caroline Street, Burlington, VT – Located at 103 Caroline Street in Burlington’s sought-after Five Sisters neighborhood just moments from Callahan Park. This rare duplex offers incredible potential.
Multi-family properties across northwest and central Vermont are experiencing significant price appreciation and renewed buyer activity in 2025. The median sale price across all five counties rose to $536,000, up 26.86% year-over-year, while the average sale price increased over 33% to $652,704. Sales volume also climbed, with 87 multi-family properties sold, a nearly 28% increase over 2024.
New listings were up as well—163 properties listed, marking a healthy 11.6% increase—providing more opportunities in a segment often marked by tight supply. Despite rising interest rates nationally, the average days on market (DOM) rose only modestly to 69 days, suggesting that properties are still moving at a reasonable pace relative to their price points.
Chittenden County remains the most active and competitive market for multi-family housing, with 58 properties sold, representing a 76% increase in sales and a median sale price of $596,463. Washington County had more moderate pricing but steady activity, with 17 sales and a nearly 15% increase in median price. In contrast, Franklin County experienced a decline in activity, with only 8 properties sold (down 27%) and listings down as well. Addison County remained flat in sales but posted moderate price appreciation.
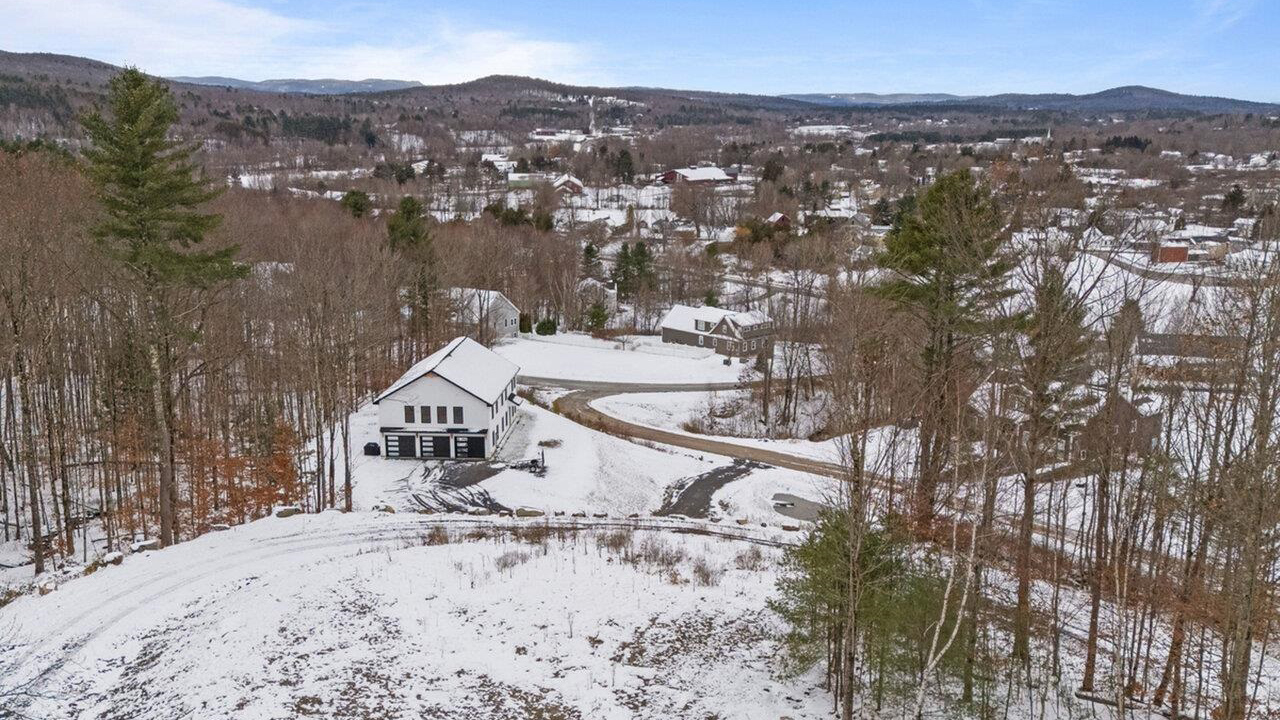
0 Maxfield Road, Waterville VT ~ A great opportunity awaits with this 7.34-acre parcel made up of three separate building lots being sold together as a package.
Lamoille County’s single-family home market held steady in 2025, with a median sale price of $500,000. Overall demand remained stable: 97 homes sold, up 3% from the previous year, while new listings fell by 8%. Homes took longer to sell on average, with days on market (DOM) rising to 87 days, a notable 40-day increase. Historical trends show the market has more than doubled since 2020, even if pricing is now leveling off. This plateau may indicate a market adjusting after years of rapid appreciation.
The condo segment presents a more complex picture. The median sale price declined 10% to $364,950, but the average sale price spiked 16.5%, reaching $825,008, suggesting that high-end units in Stowe and other towns are driving up average values. Condo sales surged 56%, with 50 units sold, and listings rose over 61%. In contrast, multi-family properties experienced a dramatic surge in price. The median sale price jumped 145% to $625,000, and the average price increased a staggering 158% to $695,750, despite only 8 sales. Meanwhile, land sales dipped nearly 15%, with median sale prices up 36% to $120,000, and average sale prices up nearly 33%, suggesting solid demand for buildable lots despite fewer transactions.
Town-level trends reveal wide variation. Stowe remains Lamoille County’s luxury leader, with a median sale price of single-family homes at $1.14M, despite a modest 10% decline in price year over year. Stowe condos also performed well, with a median sale price of $476,000 and 42 units sold—up 45%.
Cambridge showed momentum, with a 150% increase in single-family sales and strong condo growth. Meanwhile, Morristown saw slight price softening and a 17% drop in sales, but it remained an active hub for single-family homes.
20 Winter Street, Montpelier, VT ~ This exceptional, 4-bedroom, 3-bath home beautifully blends timeless character with thoughtful modern updates across 2,650 square feet of living space.
The Washington County real estate market in 2025 shows a steady upward trend in home prices, particularly in the single-family segment. The median sale price for single-family homes rose to $405,000, up 4.79% from last year, while the average price increased slightly to $499,588. Sales activity also strengthened, with 212 units sold, marking a 9.28% increase, and new listings jumped 37% to 398, suggesting improved seller confidence. Homes are spending a bit more time on the market, averaging 51 days.
Condo performance was mixed: themedian sale price ticked up modestly to $327,900, but units sold fell 25% year-over-year. Condos averaged 54 days on the market, more than double last year’s pace. In contrast, the multi-family market saw a major surge in pricing, with average values jumping nearly 100% to $577,565, despite a 15% drop in units sold. Land prices declined sharply, but demand grew, with 38 land sales and new listings rising by 18%.
The town-by-town data reveals significant variation across the county.Montpelier continues to show strong, steady growth with 38 single-family homes sold (up 100%), a median sale price of $514,500, and a swift 29-day average on market. Berlinsaw substantial price appreciation and sales growth. On the higher end of the market, Warrenstood out with a median sale price of $1,095,000, leading the county in luxury values. Waterbury, though still commanding strong prices, experienced a decline in sales volume and a rise in days on market.
In the condo segment, Warren led in activity, with 20 units sold and a median sale price of $332,500, while Montpelier posted a 10% increase in median sales price but fewer sales. These town-level patterns suggest that while demand for homes remains high, particularly in areas with strong amenities and accessibility, the smaller condo and land markets vary.
Overall, Washington County’s real estate landscape remains diverse and dynamic, with growth anchored in strong-performing hubs like Montpelier, Berlin, and Warren.
The Chittenden County real estate market remains robust in 2025, especially in the single-family segment, where prices rose modestly and sales volume increased sharply. The median sales price for single-family homes reached $590,000, a 2.61% increase.
Single-Family January-June 2025
Median Sale Price:
Average Sale Price:
Units Sold:
Newly Listed:
Days on Market:
$590,000 | 2.61%
$662,782 | -2.9%
465 | 15.1%
732 | 21.6%
32 | 3.2%
Condos January-June 2025
Median Sale Price:
Average Sale Price:
Units Sold:
Newly Listed:
Days on Market:
$384,950 | 8.9%
$420,666 | 2.3%
234 | -7.9%
384 | -1.8%
39 | 69.5%
Sales volume jumped 15.1% year-over-year to 465 homes sold, and new listings increased by over 21%, improving opportunities for buyers. However, homes moved quickly, with an average of just 32 days on market, indicating continued strong demand in Vermont’s most competitive housing region.
The condominium markethad a mixed year. The median sale price rose 8.86% to $384,950, and the average sale price increased 2.34% to $420,666, showing steady appreciation. Although the number of sales fell by nearly 8%, while new listings and market pace remained mostly flat, this may be a result of the product mix available versus buyer demand. Meanwhile,multi-family properties surged in activity, with 58 units sold—a 75% increase—and moderate price growth. Landsales also edged up slightly, reflecting growing interest from buyers seeking building opportunities
At the town level,Burlington led in activity, with 78 single-family homes sold, and a modest median sales price gain to $547,500. South Burlingtonalso stood out with 76 homes sold and a 15% median sold price increase to $690,000. In Charlotte, high-end activity pushed the median single-family sold price to over $1 million, a 54% increase. Shelburne and Richmondalso posted strong median price gains—up 33% and 27%, respectively—highlighting ongoing luxury demand. Conversely, Essex, Milton, and Williston saw flat or slightly negative price movement, with modest declines in unit sales. Smaller towns like Hinesburg, Bolton, and St. Georgehad highly variable results due to limited sample sizes.
With a commanding 26% market share, Coldwell Banker Hickok & Boardman Agents are the market leaders in Chittenden County real estate– successfully guiding more than 400 property owners so far in 2025.