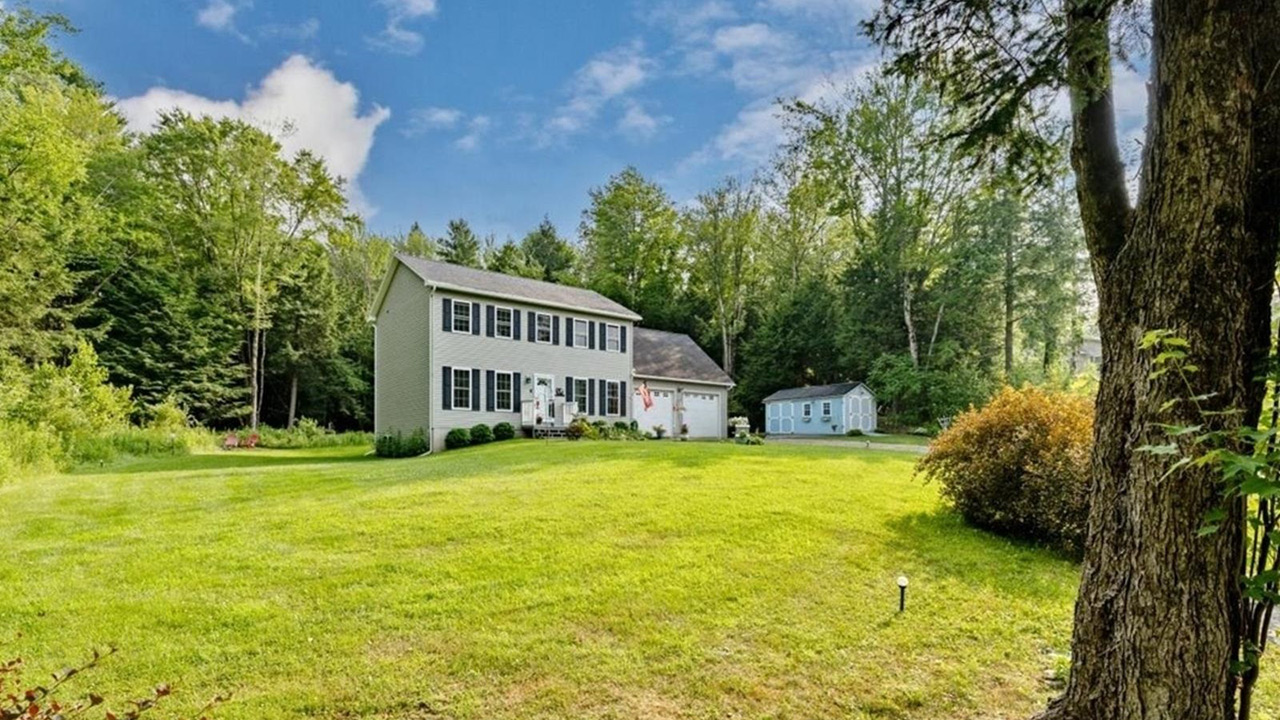
The single-family home market in Addison County has experienced significant growth in median sales prices over the past eight years, with values rising from $269,000 in 2018 to $477,500 in the first half of 2025- a 78% increase. After units sold steadily declined from a high in 2021, a 32% increase in newly listed homes so far this year has resulted in a 19% increase in sales. This trend shows a 15% year-over-year increase in median sale prices.
| Single-Family January-June 2025 | ||||
|---|---|---|---|---|
| Median Sale Price: | Average Sale Price: | Units Sold: | Newly Listed: | Days on Market: |
| $477,500 15.1% | $538,069 3.4% | 106 19.1% | 196 32.4% | 56 9.8% |
| Condos January-June 2025 | ||||
|---|---|---|---|---|
| Median Sale Price: | Average Sale Price: | Units Sold: | Newly Listed: | Days on Market: |
| $335,750 -12.8% | $344,750 -13.9% | 6 50% | 12 50% | 15 -31.8% |
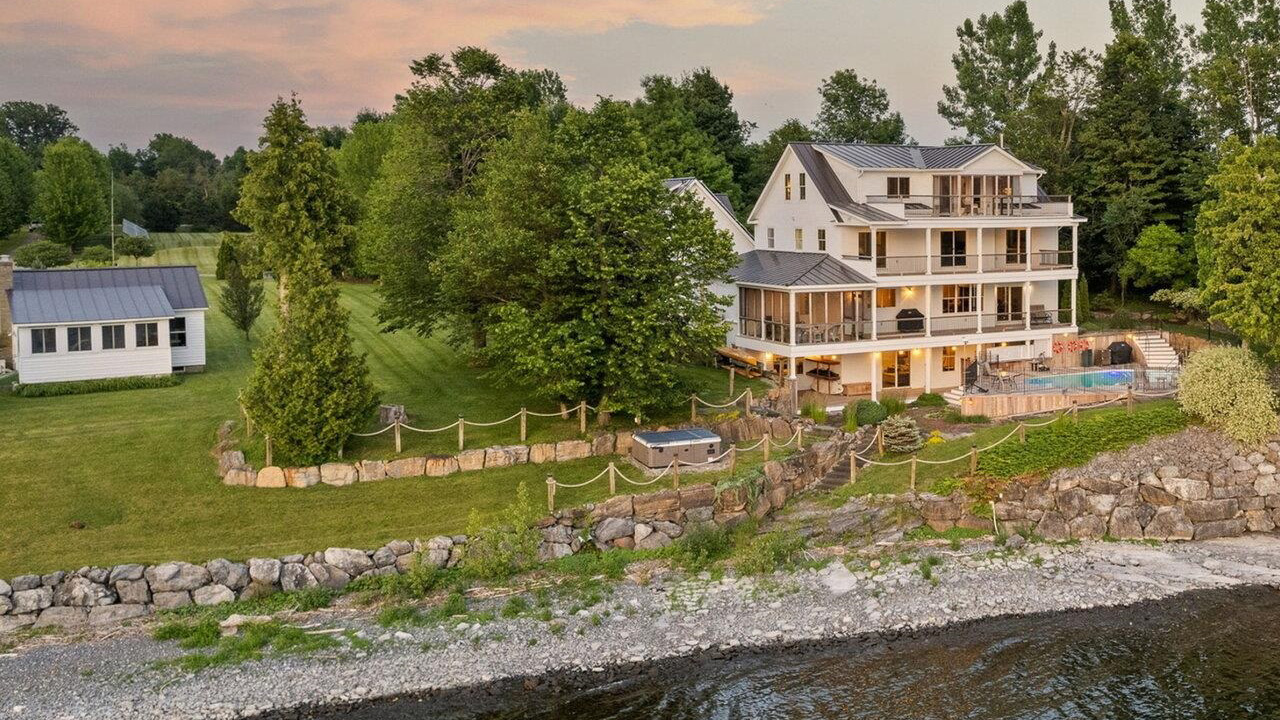
Middlebury posted the highest number of sales in the county plus a nearly 11% increase in median sale price, followed by Bristol with a 12% increase in price. Many other towns experienced declines in the median sale price or in units sold but this is a likely a result of a small number of sales affecting the data. Starksboro, Addison, Goshen, and Weybridge commanded premium prices during the 6-month period. Days on market (DOM) varied widely across the region.
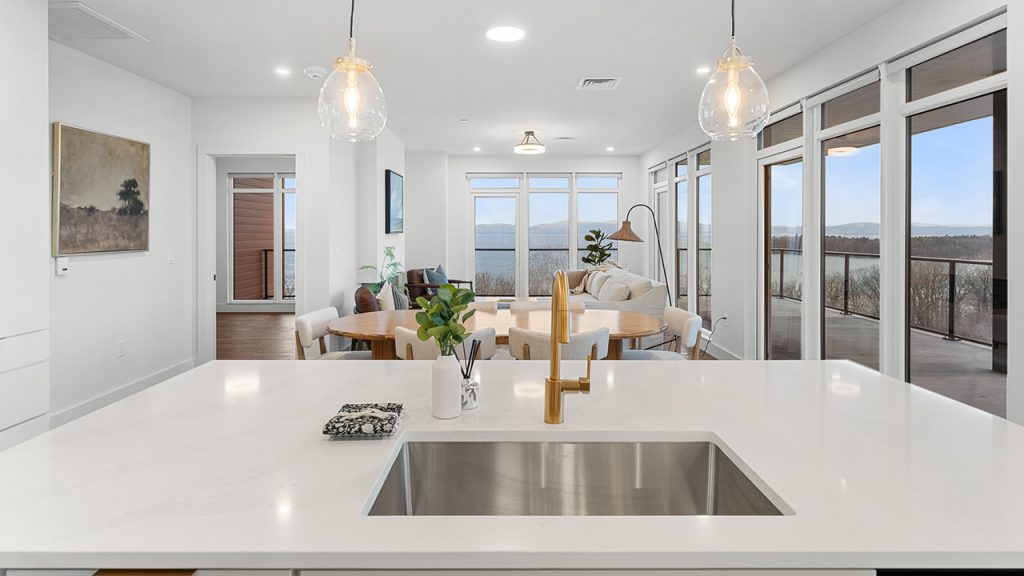
Across property types, single-family homes remain dominant, with a median sale price of $477,500, while condos, reflecting a small portion of properties sold, saw a strong increase in new listings and units sold. The median sale price of land grew 14% to $145,000. Overall, buyers have more inventory to choose from, with strong price appreciation in key towns highlighting continued demand.
Single-Family Home Prices Continue to Climb
The median price for single-family homes rose 15.1% from last year, continuing a multi-year trend of appreciation.
Land Sales Slow Despite Rising Median Prices
Land sales fell but the median price rose 13.73% to $145,000. Inventory improved, with new listings up 36%, providing more opportunities for buyers in search of custom-building sites or long-term investments.
| Addison County Single-Family | Median Price | VS 2024 | Units Sold | VS 2024 | New Listings | VS 2024 | Average DOM |
|---|---|---|---|---|---|---|---|
| Addison | $855,000 | 191.5% | 4 | 33.3% | 7 | -12.5% | 51 |
| Bridport | $385,000 | -7.1% | 7 | 250.0% | 2 | -71.4% | 86 |
| Bristol | $424,500 | 30.5% | 10 | 100.0% | 22 | 144.4% | 34 |
| Cornwall | $579,200 | -45.3% | 3 | -25.0% | 7 | 16.7% | 11 |
| Ferrisburgh | $559,000 | -45.1% | 3 | -62.5% | 11 | -26.7% | 30 |
| Goshen | $1,740,000 | 484.9% | 2 | 0.0% | 0.0% | 272 | |
| Granville | $371,500 | 198.2% | 4 | 300.0% | 4 | 300.0% | 10 |
| Hancock | $300,000 | -14.0% | 1 | 0.0% | 2 | -33.3% | 92 |
| Leicester | $470,000 | 45.0% | 2 | 0.0% | 4 | 0.0% | 32 |
| Lincoln | $469,000 | -9.3% | 4 | 0.0% | 8 | 33.3% | 30 |
| Middlebury | $454,936 | 7.9% | 20 | 66.7% | 43 | 87.0% | 36 |
| Monkton | $517,500 | -6.7% | 8 | 14.3% | 9 | 28.6% | 39 |
| New Haven | $505,000 | -16.2% | 5 | -16.7% | 8 | -11.1% | 34 |
| Orwell | $340,000 | 33.1% | 5 | 400.0% | 9 | 200.0% | 183 |
| Panton | $391,000 | 38.2% | 3 | 0.0% | 5 | 0.0% | 47 |
| Ripton | – | 0.0% | – | 0.0% | 4 | 100.0% | – |
| Salisbury | $469,000 | 20.3% | 3 | -25.0% | 10 | 42.9% | 55 |
| Shoreham | $456,250 | 24.9% | 4 | -50.0% | 9 | 12.5% | 113 |
| Starksboro | $635,000 | 102.1% | 8 | 166.7% | 8 | 60.0% | 20 |
| Vergennes | $507,000 | 16.3% | 8 | -20.0% | 15 | 15.4% | 63 |
| Waltham | – | 0.0% | 0.0% | 1 | -50.0% | – | |
| Weybridge | $855,000 | 113.0% | 2 | -33.3% | 3 | 0.0% | 112 |
| Whiting | 0.0% | – | 0.0% | 5 | 400.0% | – |
Footnotes:
- PrimeMLS, PrimeMLS.com,