Chittenden County Mid-Year Report


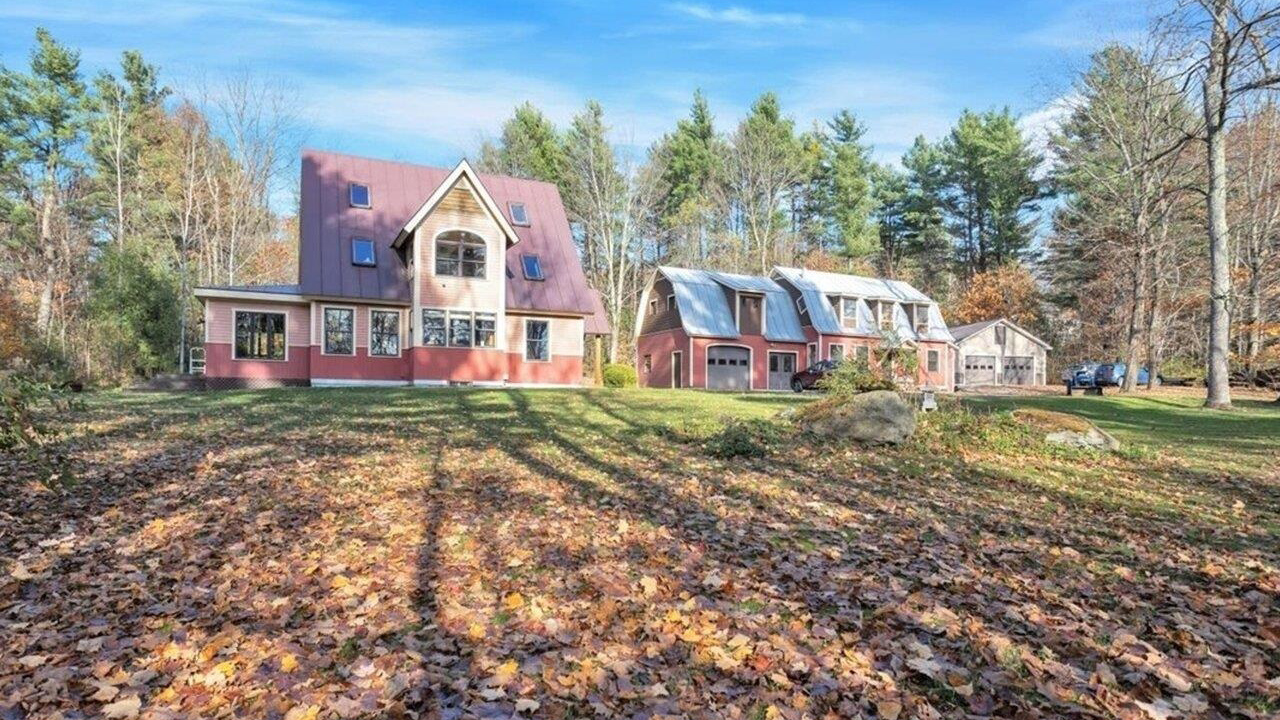
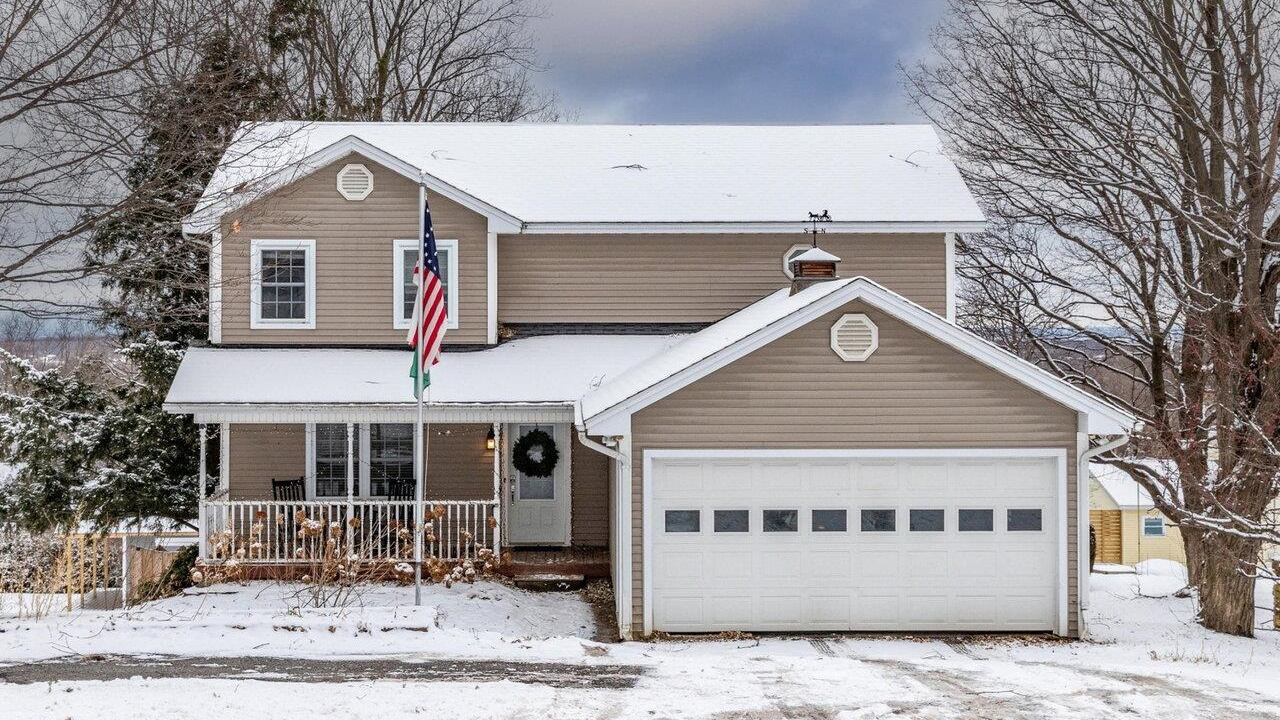
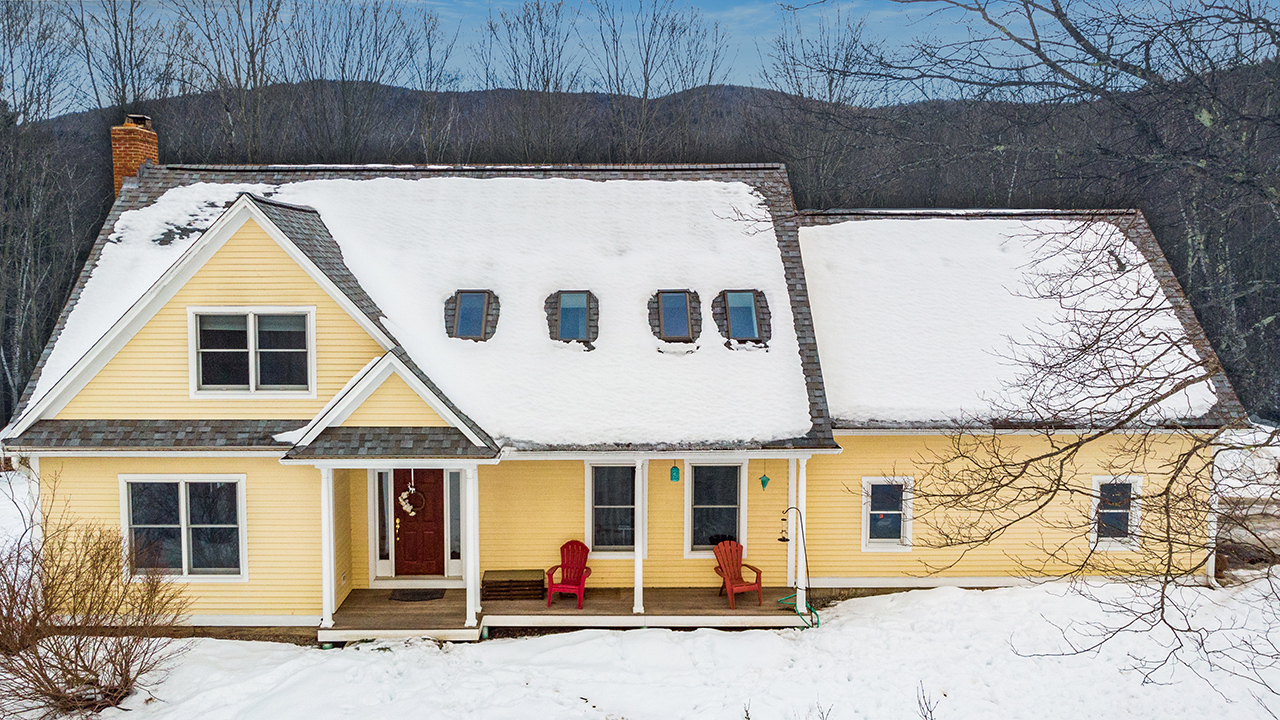
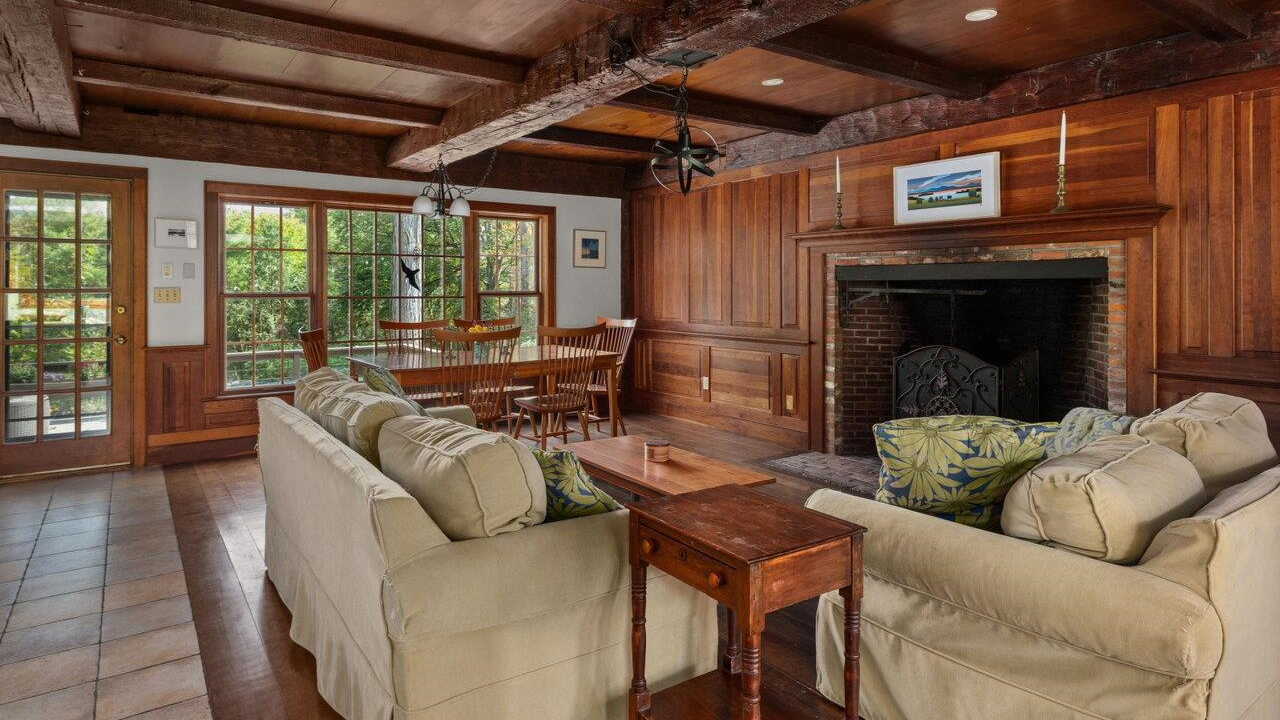
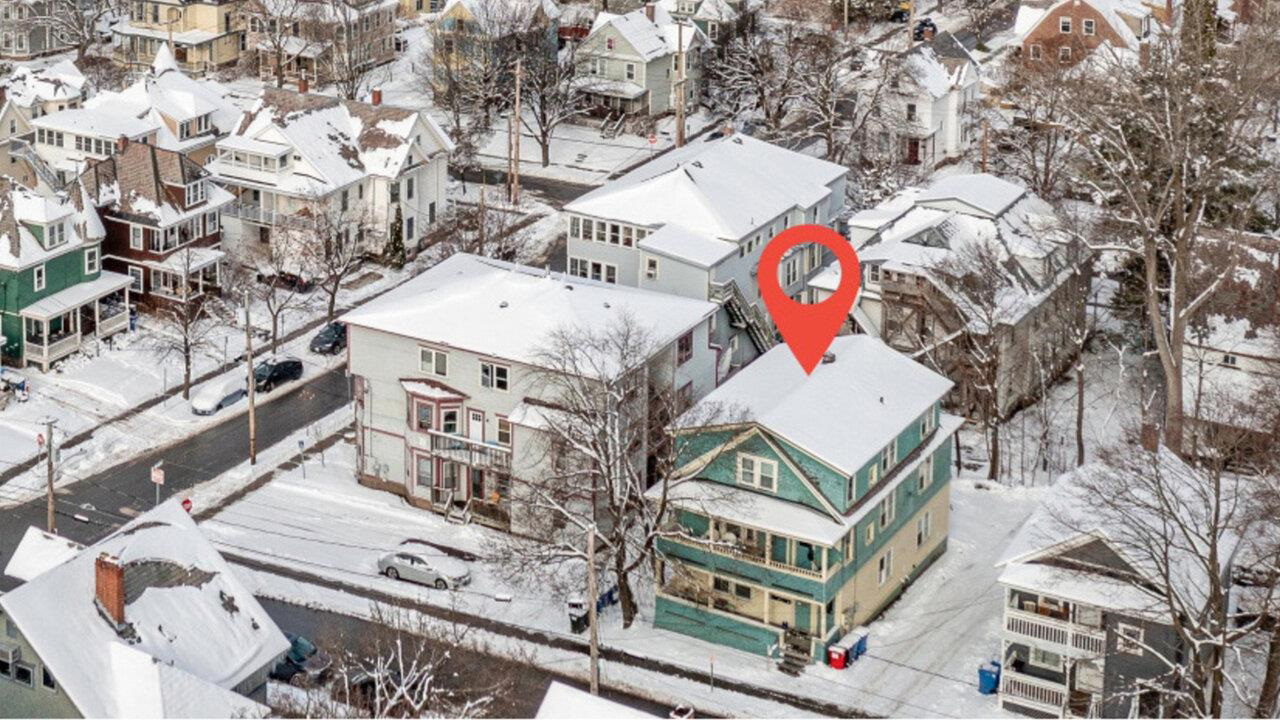
17 Pinnacle Drive, Milton, VT ~ This stunning home on Pinnacle Drive in Milton is a hidden gem with 2.95 acres!


A surge in newly listed condos and single-family homes resulted in 658 closed sales during the first 6 months of the year. This is the first time in over 5 years that the number of closed sales has not declined. Burlington, Essex, Williston, Hinesburg, and Jericho all posted increases in sales.

Single-Family January-June 2024
Median Sale Price:Average Sale Price:Units Sold:Newly Listed:Days on Market:
$575,000 +4.9% $680,847 +13.5%404 -0.3%605 +9.2%31 +10.7%
Condos January-June 2024
Median Sale Price:Average Sale Price:Units Sold:Newly Listed:Days on Market:
$355,750 -1.2% $413,025 -1.3%254 +8.6%390 +30.4%23 +35.3%

South Burlington’s drop-in single-family sales reflects a shift in new construction sales during the first half of 2023 vs 2024. As O’Brien’s Hillside East closes many new homes through the remainder of 2024, the results in South Burlington will shift.

Condos were a bright spot in Chittenden County sales, increasing nearly 9% with a 30% jump in available condos. South Burlington, Essex, Colchester, and Burlington lead the market.

SINGLE FAMILY SALE PRICEMEDIANVS 2023UNITS SOLDVS 2023NEWLY LISTEDVS 2023DAYS ON MARKET
Bolton$547,600 -5.3%3-25.0%3-40.0%5
Burlington$530,750 -13.0%724.4%11247.4%28
Charlotte$675,000 22.7%1385.7%2161.5%18
Colchester$560,000 9.2%34-19.1%59-22.4%35
Essex$575,000 18.9%631.6%8516.4%38
Hinesburg$726,000 26.8%18350.0%2768.8%57
Huntington$282,500 13.0%20.0%566.7%12
Jericho$564,750 -4.3%1863.6%2712.5%58
Milton$500,000 17.7%39-4.9%44-8.3%22
Richmond$525,000 10.0%1025.0%2484.6%6
Shelburne$690,000 -22.0%17-19.1%29-14.7%46
South Burlington$583,500 -6.8%54-25.0%89-6.3%24
St. George$885,000 31.1%1-75.0%2-60.0%5
Underhill$775,000 43.5%1233.3%1812.5%65
Westford$375,000 -33.7%70.0%1157.1%25
Williston$742,250 21.5%349.7%352.9%22
Winooski$410,000 13.9%7-36.40%14-12.5%7
CONDO SALE PRICEMEDIANVS 2023UNITS SOLDVS 2023NEWLY LISTEDVS 2023DAYS ON MARKET
Bolton$315,000 11.3%433.3%433.3%17
Burlington$320,000 -15.0%452.3%8770.6%19
Charlotte$350,000 0.0%10.0%2100.0%6
Colchester$361,750 -8.4%2420.0%3719.4%18
Essex$353,250 -2.5%398.3%551.9%29
Hinesburg$545,000 89.2%10.0%350.0%4
Jericho$345,000 -9.5%3-25.0%2-60.0%5
Milton$488,952 103.7%14180.0%1721.4%65
Richmondn/a0.0%n/a0.0%10.0%n/a
Shelburne$510,000 -14.6%13-13.3%2981.3%21
South Burlington$339,000 1.2%7816.4%10739.0%21
Williston$460,000 8.9%25-10.7%3616.1%13
Winooski$339,000 -3.7%7-36.4%10-28.6%12

Addison County Mid-Year Report


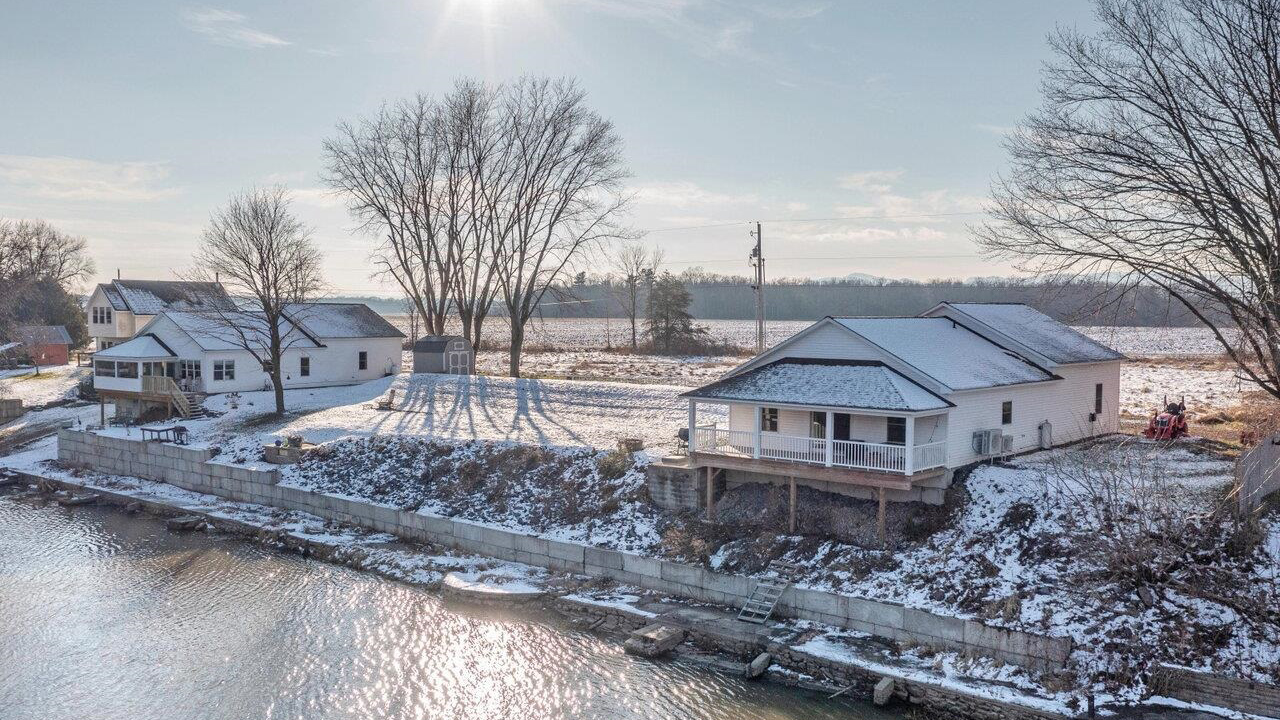
46 Riverview Street, Ferrisburgh, VT ~ Nestled on the banks of Otter Creek, with direct access to Lake Champlain, this property built in 2021 offers convenient one-level living with an open concept design.

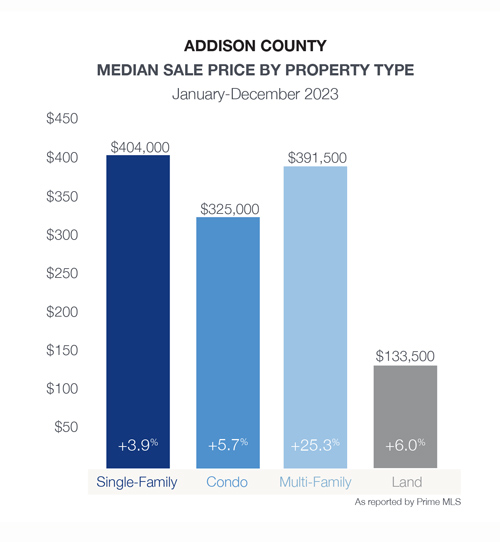
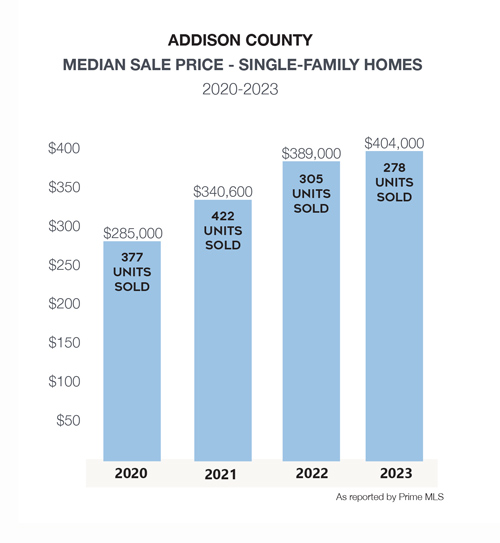
The median sale price of single-family homes jumped nearly 10% in Addison County as inventory on the market did not see the rebound recognized in other areas of northwest Vermont. Closed sales dropped sharply, exceeding the rate of decline in previous years. Middlebury saw a 25% decline in closed sales, however, an increase in newly listed homes may turnaround those results in the 3rd quarter. While we may speculate that second home and luxury home purchasers paused during the first half of the year, the increase in the median sale price does not support that theory. With a small statistical sample over the 6 months of this report, we will have a better barometer as to the market trends in Addison County as the year progresses.

Single-Family January-June 2024
Median Sale Price:Average Sale Price:Units Sold:Newly Listed:Days on Market:
$412,500 +9.7% $517,985 +10.9%90 -25.6%148 -13.5%51 +41.7%
Condos January-June 2024
Median Sale Price:Average Sale Price:Units Sold:Newly Listed:Days on Market:
$385,000 +19.2% $400,500 +5.0%4 -50.0%8 0.0%22 +57.1%

SINGLE-FAMILY SALE PRICEMEDIANVS 2023UNITS SOLDVS 2023NEWLY LISTEDVS 2023DAYS ON MARKET
Addison$320,000 -39.5%30.0%814.3%102
Bridport$460,500 81.8%2-66.7%7-46.2%309
Bristol$380,000 3.8%5-58.3%9-35.7%50
Cornwall$1,075,000 104.8%4-20.0%6-25.0%3
Ferrisburgh$630,000 19.1%8-20.0%15-6.3%24
Goshen$297,500 0.0%20.0%10.0%22
Granville$126,000 -69.3%1-50.0%1-66.7%5
Hancock$349,000 -7.2%10.0%3-40.0%7
Leicester$324,223 -27.0%2-50.0%433.3%97
Lincoln$492,500 -26.1%4100.0%6200.0%71
Middlebury$410,000 11.6%12-25.0%2315.0%28
Monkton$558,500 45.1%7-22.2%7-41.7%73
New Haven$561,375 15.8%620.0%980.0%19
Orwell$350,000 16.9%1-90.0%3-72.7%253
Panton$340,000 1.5%3200.0%566.7%3
Riptonn/a0.0%n/a0.0%2-33.3%n/a
Salisbury$340,000 23.6%433.30%7-22.2%20
Shoreham$389,500 -6.10%860.00%814.30%124
Starksboro$350,000 53.90%3-50.00%5-37.50%48
Vergennes$390,000 11.40%110.00%138.30%19
Walthamn/a0.00%n/a0.00%2-33.30%n/a
Weybridge$410,000 -18.30%3-40.00%3-50.00%8
Whitingn/a0.00%n/a0.00%10.00%n/a

Franklin County Mid-Year Report

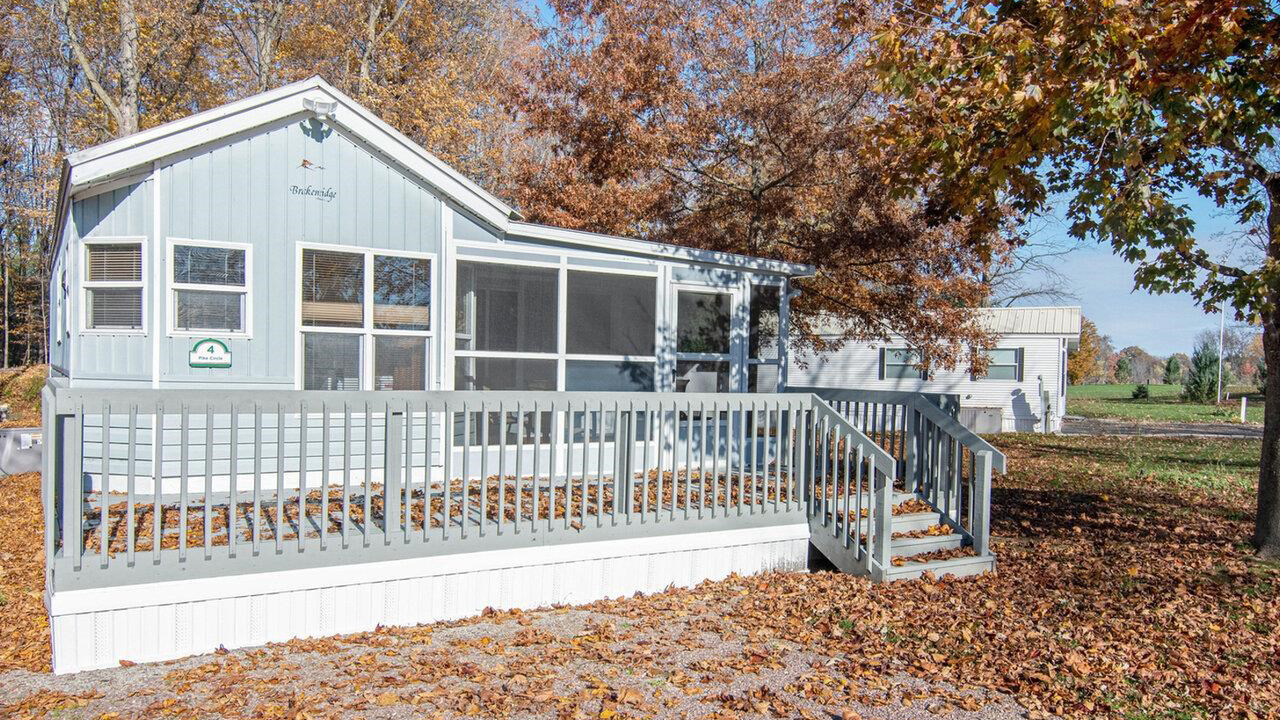
493 Nichols Road, Fairfax, VT ~ Experience tranquility and versatility in this beautifully-maintained, 3-bedroom, 2-bath home featuring an adjacent 2-bedroom apartment.

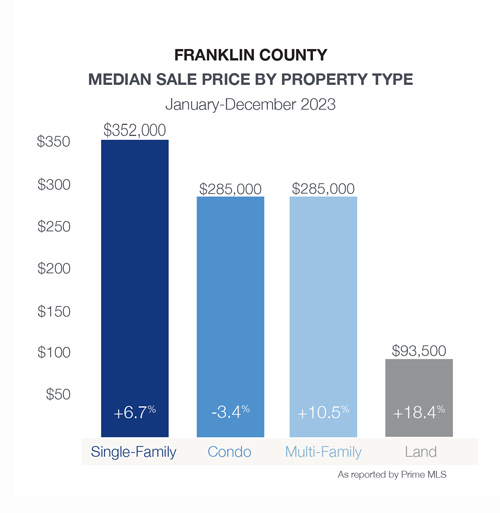
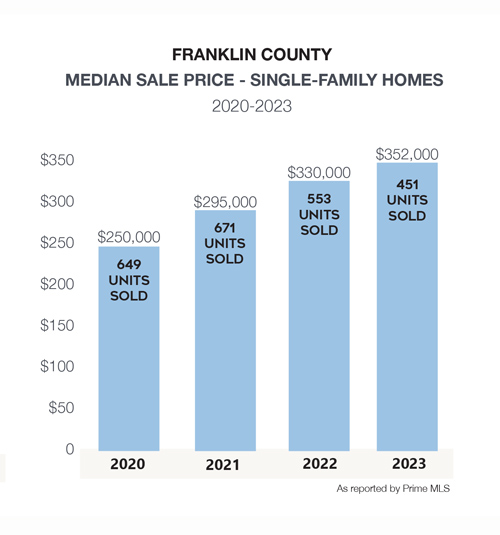
There is lots of good news for the housing market in Franklin County. Still the most affordable of the counties in this report, sales of single-family homes and condos surged this year. This was fueled by a 15% increase in homes listed for sale. The data by city/town shows a clear correlation between the increase in inventory and the increase in closed sales. St. Albans, Swanton, Georgia, and Enosburg lead the way, while sales and inventory dropped sharply in Fairfax. The new inventory to market bodes well for buyers’ options in their home search.

Single-Family January-June 2024
Median Sale Price:Average Sale Price:Units Sold:Newly Listed:Days on Market:
$369,000 5.4% $384,663 +7.3%197 +8.2%316 +14.5%46 +2.2%
Condos January-June 2024
Median Sale Price:Average Sale Price:Units Sold:Newly Listed:Days on Market:
$314,000 +10.2% $320,127 +6.1%28 +100.0%28 -9.7%21 +162.5%

SINGLE-FAMILY SALE PRICEMEDIANVS 2023UNITS SOLDVS 2023NEWLY LISTEDVS 2023DAYS ON MARKET
Bakersfield$289,000 27.2%775.0%980.0%14
Berkshire$251,000 -8.1%525.0%10100.0%18
Enosburg$286,500 -10.2%1271.4%140.0%58
Fairfax$500,000 -4.4%19-40.6%25-24.2%26
Fairfield$511,950 -104.8%860.0%1362.5%47
Fletcher$369,000 41.0%3200.0%4-33.3%43
Franklin$339,000 3.7%4-42.9%8-11.1%15
Georgia$464,000 -4.3%1721.4%2519.1%27
Highgate$376,000 -1.6%5-44.4%210.0%10
Montgomery$280,000 30.7%9350.0%1137.5%77
Richford$192,000 -1.1%12-14.3%19-9.5%64
Sheldon$320,700 -0.2%1066.7%1536.4%36
St. Albans$375,000 -10.3%514.1%9224.3%51
Swanton$375,000 -23.0%3525.0%5025.0%60

Grand Isle County Mid-Year Report

241 East Shore North, Grand Isle, VT ~ Discover serenity in this 3-bedroom, 3-bath lakefront home on 10.4 acres, offering majestic views of Lake Champlain & the Green Mountains.

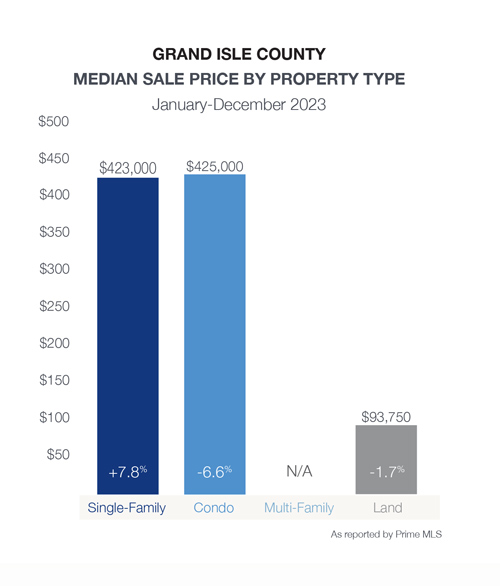
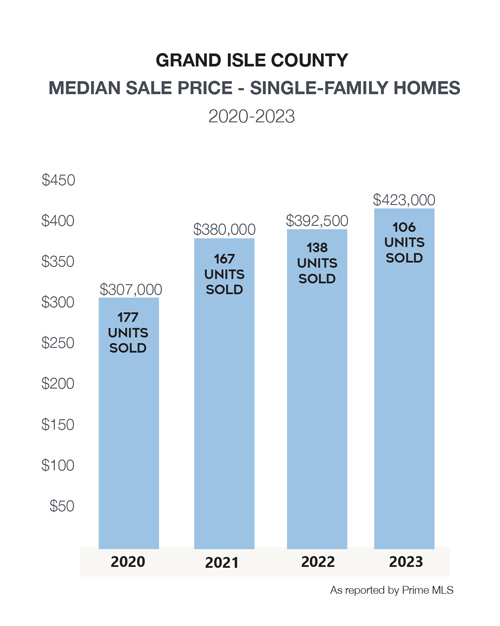
The housing market in Grand Isle is typically cooler during the first 6 months of the year. With only 37 sales during this period, the reported data can be misleading. The median sale price of single-family homes was stable at $400,000 yet lower than the 2023 year-end median price of $423,000. No luxury home sales have been closed so far in 2024, which is very likely to change during the summer months. 81 single family homes were listed during the period which will likely result in an increase in units sold through the 3rd and 4th quarters of the year.

Single-Family January-June 2024
Median Sale Price:Average Sale Price:Units Sold:Newly Listed:Days on Market:
$400,000 +1.5%$467,828 -9.7%37 -2.6%81 +20.9%65 +1.4%
SINGLE-FAMILY SALE PRICEMEDIANVS 2023UNITS SOLDVS 2023NEWLY LISTEDVS 2023DAYS ON MARKET
Alburgh$310,0000.17130270.0884
Grand Isle$390,000-0.025110.222210.31338
Isle La Motte$639,900-0.04950.25100.111112
North Hero$656,2500.5634-0.33390.12562
South Hero$595,500-0.0624-0.333140.55624