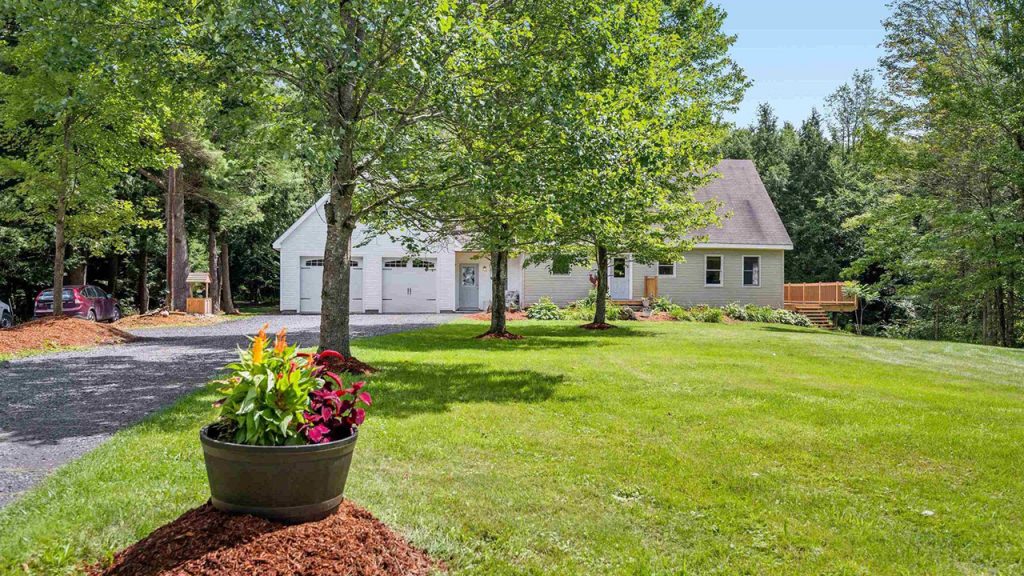
Robust and varied, the Washington County real estate market showed steady growth in 2024, with single-family homes experiencing a 7.9% increase in median sales price to $410,000 and a slight rise in sales (+2%). Condominiums saw a 6.6% increase in median sales price to $325,000 and an 18.4% jump in sales – likely a result of 21% more condos being available to purchase.
| Single-Family January-December 2024 | ||||
|---|---|---|---|---|
| Median Sale Price: | Average Sale Price: | Units Sold: | Newly Listed: | Days on Market: |
| $410,000 7.9% | $502,592 11.0% | 476 1.7% | 639 11.1% | 33 10.0% |
| Condos January-December 2024 | ||||
|---|---|---|---|---|
| Median Sale Price: | Average Sale Price: | Units Sold: | Newly Listed: | Days on Market: |
| $325,000 6.6% | $352,086 -1.2% | 116 18.4% | 138 21.1% | 26 8.3% |
The median sales price of land rose by 7.4% to $145,000, while inventory remained stable and units sold declined. Multi-family pricing remained steady with a median sales price of $285,000 with an 18% decline in sales despite more properties being available for buyers to choose from. Barre led the county in sales of single-family homes, with a median price of $320,250 (+10.4%).
Luxury markets thrived with a 43.4% increase in median sales price in Fayston, and a 10.5% increase in Warren (+10.5%), attracting buyers looking for high-end properties. Montpelier showed moderate growth in single-family home prices (+3.15%) for the 61 units sold. Warren stood out for strong demand across residential property types, with single-family and condo median sales prices rising 10.48% and 17.78%, respectively.
| Washington County Single Family | Median Price | VS 2023 | Units Sold | VS 2023 | New Listings | VS 2023 | Average DOM |
|---|---|---|---|---|---|---|---|
| Barre | $320,250 | 10.4% | 156 | 15.6% | 190 | 14.5% | 27 |
| Berlin | $370,000 | -1.3% | 19 | 0.0% | 27 | 12.5% | 39 |
| Cabot | $274,500 | -10.0% | 13 | 18.2% | 12 | -29.4% | 53 |
| Calais | $530,000 | 1.0% | 19 | 0.0% | 25 | -13.8% | 73 |
| Duxbury | $443,500 | -1.4% | 9 | 0.0% | 13 | 30.0% | 30 |
| East Montpelier | $620,000 | 53.1% | 16 | 0.0% | 25 | 8.7% | 36 |
| Fayston | $939,000 | 43.4% | 9 | -52.6% | 16 | -20.0% | 29 |
| Marshfield | $375,000 | 1.4% | 11 | 22.2% | 21 | 90.9% | 41 |
| Middlesex | $450,000 | 9.2% | 15 | 50.0% | 20 | 81.8% | 25 |
| Montpelier | $475,000 | 3.2% | 61 | -12.9% | 79 | 12.9% | 20 |
| Moretown | $660,000 | 76.0% | 7 | -30.0% | 9 | -40.0% | 67 |
| Northfield | $300,000 | -5.4% | 33 | 6.5% | 39 | -2.5% | 33 |
| Plainfield | $425,000 | 52.3% | 9 | 12.5% | 13 | 30.0% | 107 |
| Roxbury | $304,000 | 10.6% | 6 | 100.0% | 10 | 42.9% | 15 |
| Waitsfield | $670,000 | 46.5% | 10 | 0.0% | 20 | 33.3% | 34 |
| Warren | $775,000 | 10.5% | 27 | 28.6% | 39 | 50.0% | 41 |
| Waterbury | $650,000 | 21.5% | 41 | -12.8% | 59 | 18.0% | 21 |
| Woodbury | $269,000 | 3.5% | 10 | -23.1% | 15 | -16.7% | 56 |
| Worcester | $499,000 | 1.8% | 5 | -37.5% | 7 | -46.2% | 33 |
| Washington County Condo | Median Price | VS 2023 | Units Sold | VS 2023 | New Listings | VS 2023 | Average DOM |
|---|---|---|---|---|---|---|---|
| Barre | $335,000 | 13.2% | 7 | 0.0% | 6 | -33.3% | 19 |
| Fayston | $373,750 | 5.0% | 6 | -50.0% | 8 | -20.0% | 14 |
| Montpelier | $277,000 | -10.7% | 18 | -5.3% | 21 | -4.6% | 15 |
| Moretown | $324,750 | 80.9% | 4 | 0.0% | 5 | 25.0% | 98 |
| Waitsfield | $357,500 | 24.1% | 12 | 100.0% | 11 | 10.0% | 14 |
| Warren | $320,000 | 0.0% | 53 | 17.8% | 63 | 23.5% | 32 |
| Waterbury | $384,900 | 31.7% | 11 | 175.0% | 17 | 142.9% | 25 |

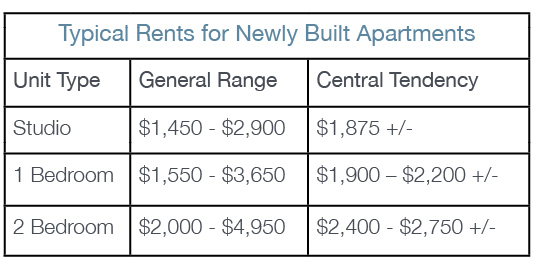 Of the new apartments, South Burlington led with 422 units, followed by Burlington with 287. The rest—totaling 115—were distributed among Colchester, Shelburne, Williston, Milton, Winooski, Charlotte, and Westford. Of further note, 364 of these units were completed by UVM and the UVM Health Network and are not publicly available, rather they helped ease overall market strain by reducing the number of potential students and medical professionals seeking housing options in the broader market.


 It is unclear if there will be a Fed rate cut in 2024 – which many experts were hoping for. If
 South Burlington’s drop-in single-family sales reflects a shift in new construction sales during the first half of 2023 vs 2024. As O’Brien’s